Sarasota, Manatee & Charlotte County Market Report (August 2026): Two Counties Crossed Into Seller's Markets. All Three Sold Fewer Homes.
Darren Dowling
Darren Dowling
Published September 2026 | Single-Family Home Data from Florida Realtors® SunStats
August 2026 produced the most internally contradictory data sheet of the year for Southwest Florida. Every measure of seller leverage moved in sellers' favor across all three counties, while closed sales hit a five-month low in every one of them. Sarasota and Manatee both fell below the four-month supply threshold that marks a seller's market. Homes went under contract 15% to 32% faster than a year earlier. Sellers kept more of their asking price in all three counties. And Sarasota County's median sale price fell 1.1% year over year, the first negative median in this series.
The market got faster, tighter, and more seller-friendly. It also sold fewer houses. Both of those are true, and this report separates them.
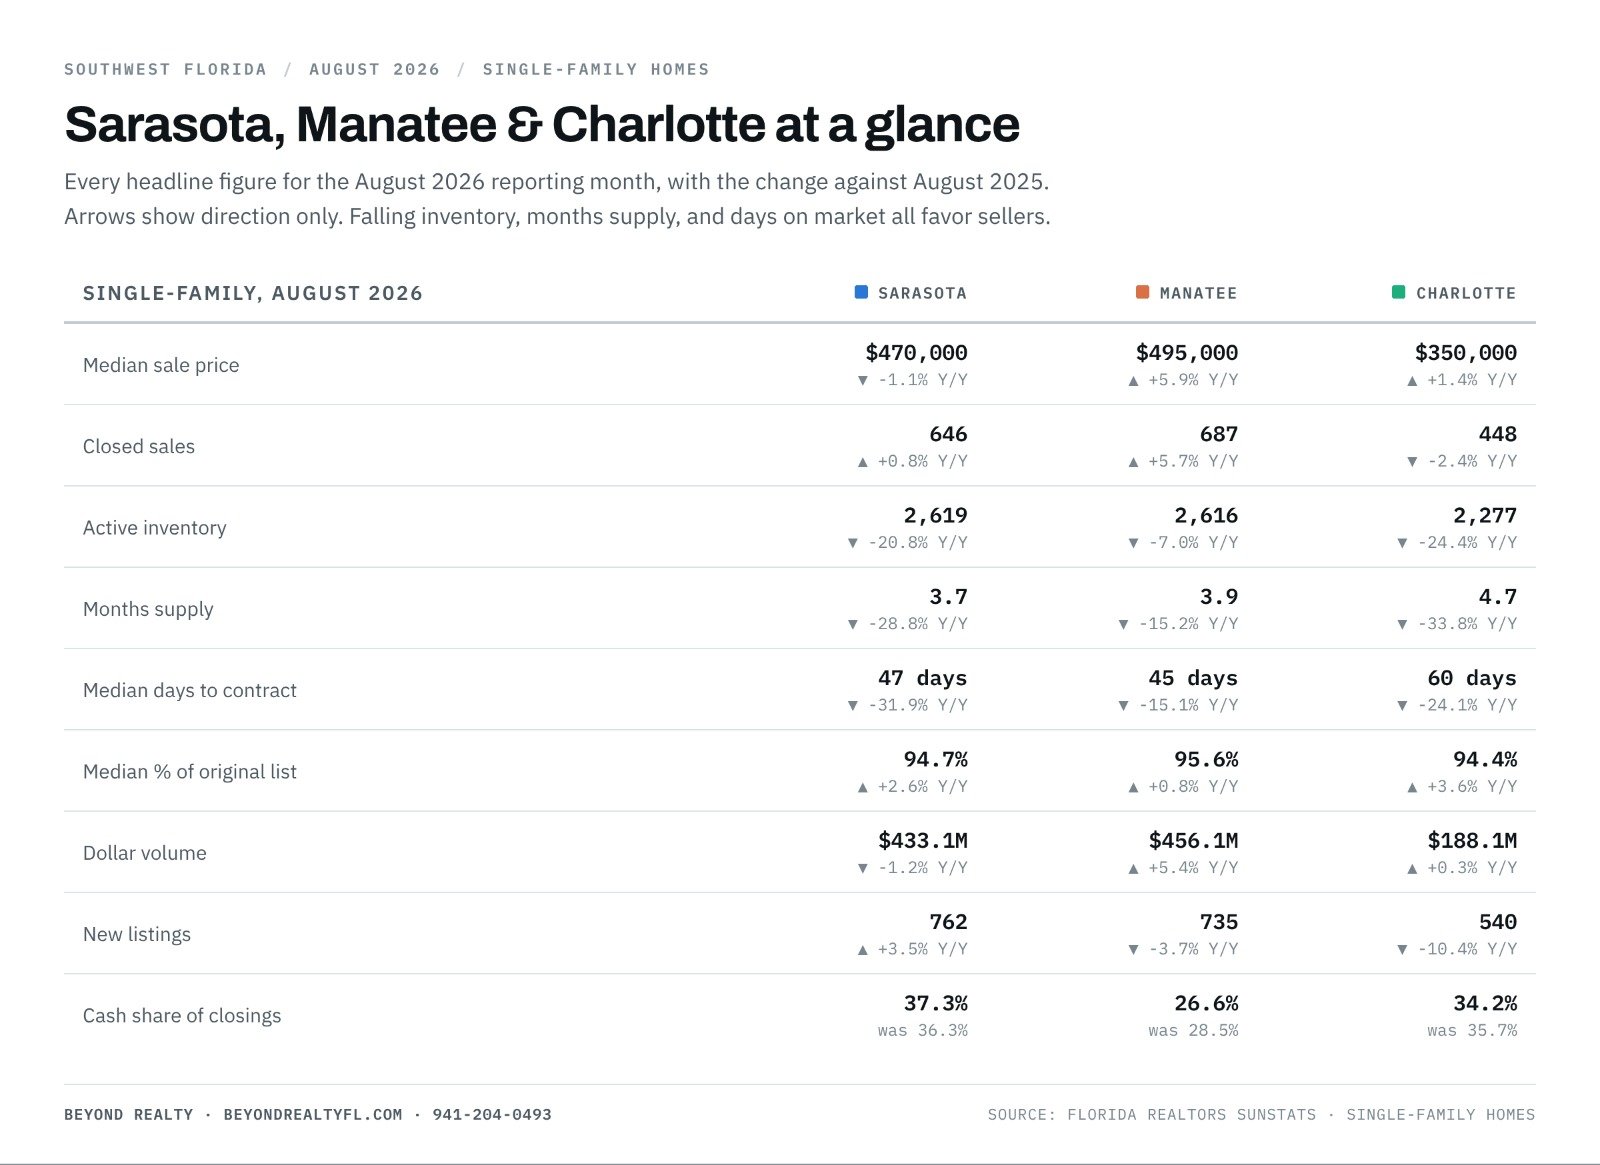
August 2026 single-family data for all three counties. Source: Florida Realtors SunStats.
In August 2026, Sarasota County's months supply of inventory fell to 3.7 and Manatee County's to 3.9, putting two of the three Southwest Florida counties in seller's-market territory, while Charlotte County reached 4.7, inside the balanced band for the first time in this series. Median percent of original list price rose year over year in all three counties, to a range of 94.4% to 95.6%, and median time to contract improved by 15.1% to 31.9%.
At the same time, closed sales reached a five-month low in all three counties, and the tri-county total of 1,781 closed single-family sales was up just 1.8% from 1,750 a year earlier, on $1.08 billion in dollar volume, also up 1.8%.
Here's the at-a-glance version:
Metric (Single-Family, August 2026 vs. August 2025) | Charlotte | Sarasota | Manatee |
|---|---|---|---|
Closed Sales | −2.4% | +0.8% | +5.7% |
Median Sale Price | +1.4% | −1.1% | +5.9% |
Active Inventory | −24.4% | −20.8% | −7.0% |
Months Supply | 4.7 (was 7.1) | 3.7 (was 5.2) | 3.9 (was 4.6) |
Median Time to Contract | 60 days (−24.1%) | 47 days (−31.9%) | 45 days (−15.1%) |
Median % of Original List | 94.4% | 94.7% | 95.6% |
Source: Florida Realtors® SunStats, single-family homes, August 2026.
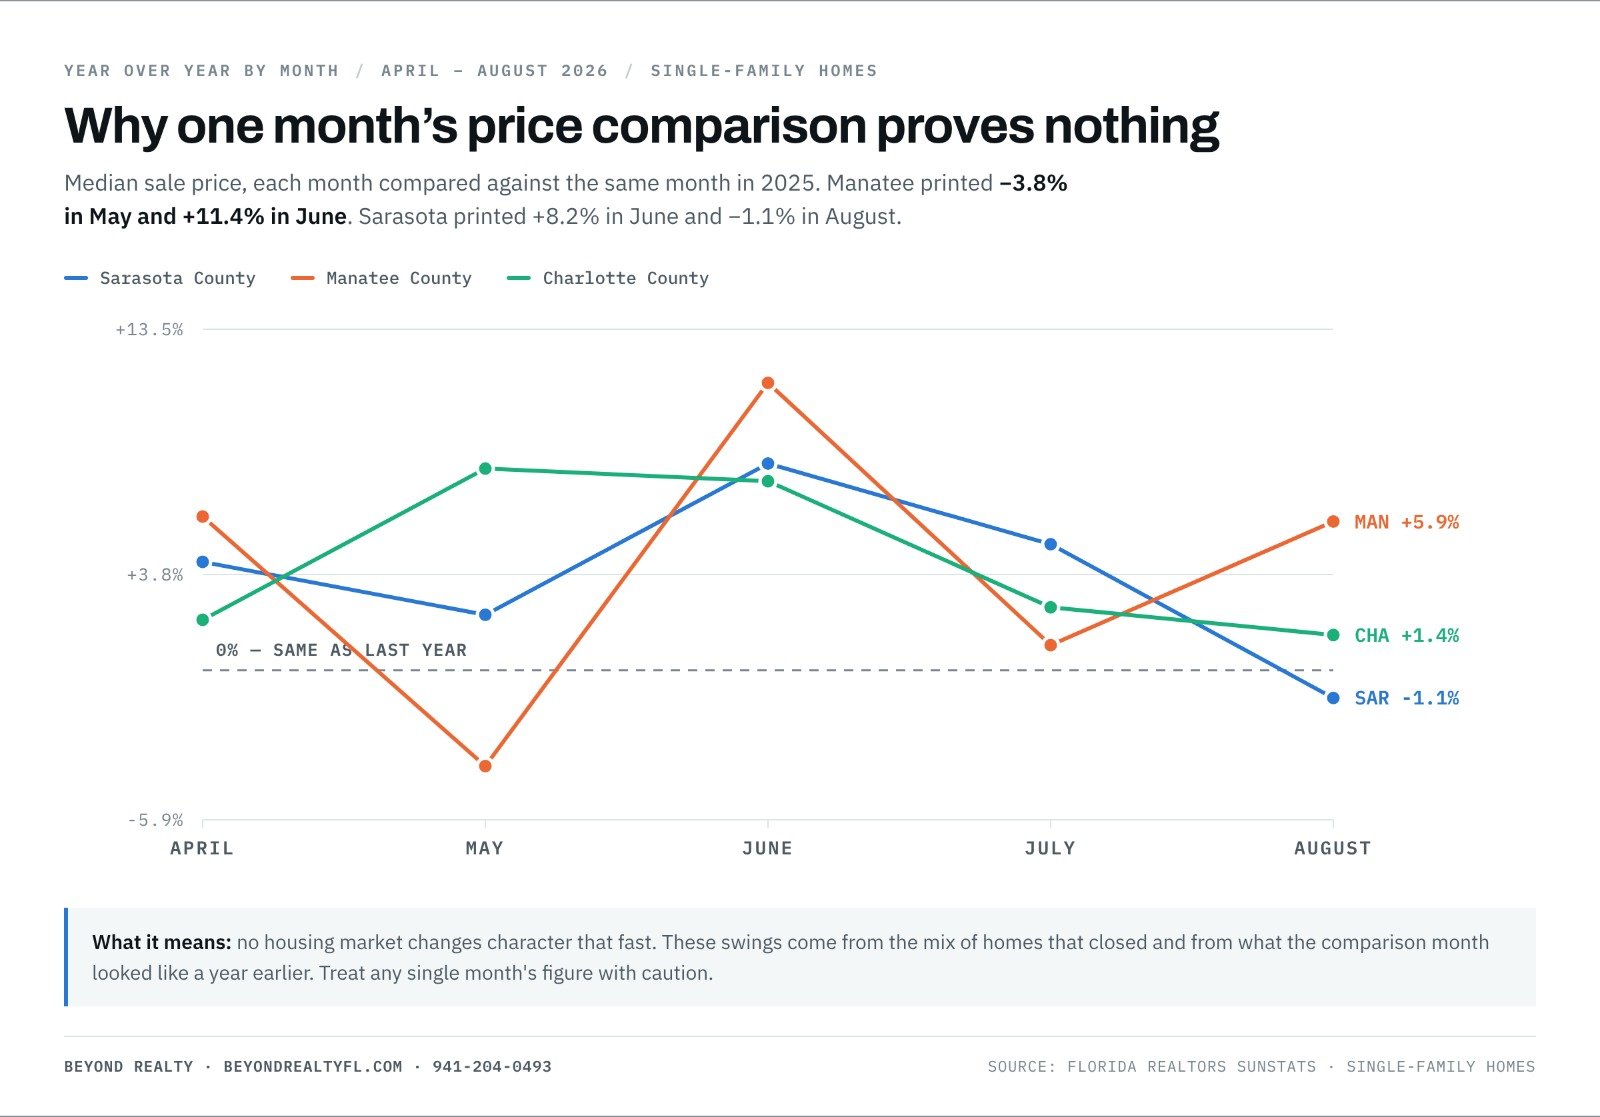
The same metric swung 15 points in one month. This is why a single year-over-year price comparison should never drive a decision.
A single year-over-year percentage tells you almost nothing about direction. The same metric can post +8.2% one month and −1.1% three months later without the underlying market changing character, because the comparison base changes every month. Tracking the year-over-year figure across months is what separates a trend from a comparison artifact.
Here is every month from April through August 2026, each compared against the same month in 2025.
Median sale price, year-over-year change by month
County | Apr | May | Jun | Jul | Aug |
|---|---|---|---|---|---|
Sarasota | +4.3% | +2.2% | +8.2% | +5.0% | −1.1% |
Manatee | +6.1% | −3.8% | +11.4% | +1.0% | +5.9% |
Charlotte | +2.0% | +8.0% | +7.5% | +2.5% | +1.4% |
This is the single most useful table in this report. Look at how violently these numbers swing. Manatee printed −3.8% in May and +11.4% in June. Sarasota printed +8.2% in June and −1.1% in August. No market changes character that fast. What changes is the mix of homes that happened to close, and what the comparison month looked like a year earlier. Anyone presenting a single month's year-over-year price change as proof of a trend, in either direction, is misreading the data.
Closed sales, year-over-year change by month
County | Apr | May | Jun | Jul | Aug |
|---|---|---|---|---|---|
Sarasota | +0.9% | +7.2% | +15.2% | +2.9% | +0.8% |
Manatee | +4.8% | −0.5% | +26.2% | +11.2% | +5.7% |
Charlotte | −3.1% | +4.9% | +9.4% | +14.0% | −2.4% |
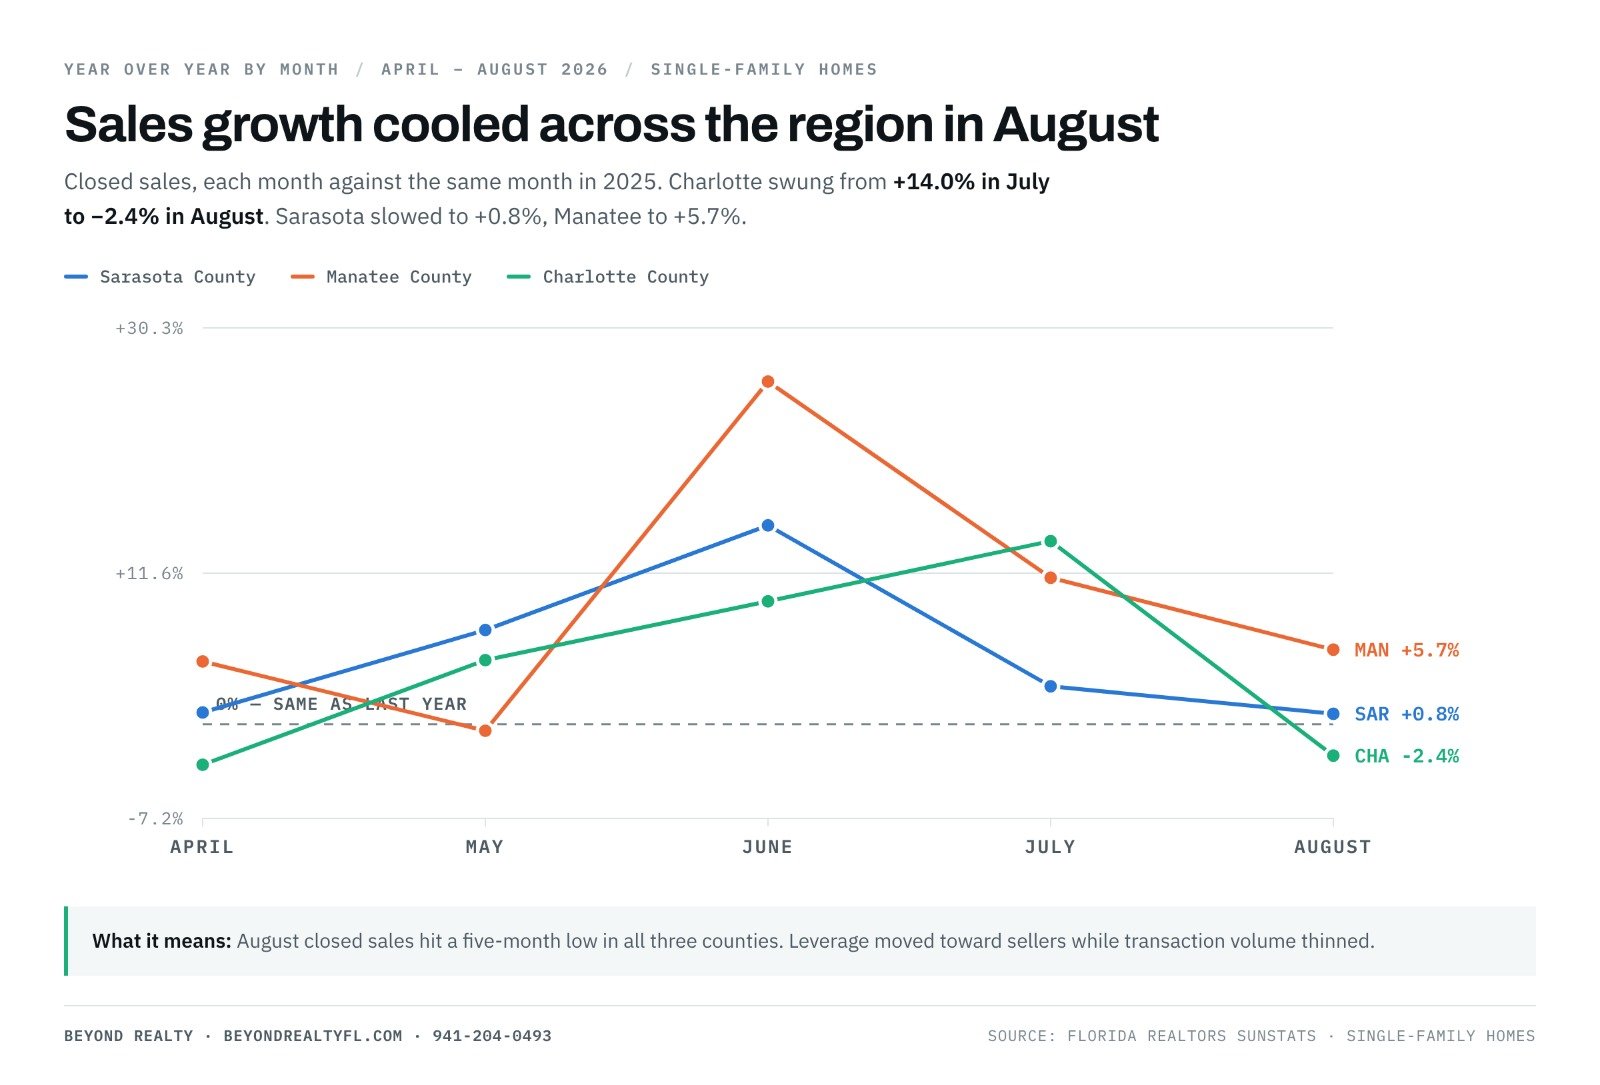
Sales growth cooled across the region in August, with closed sales hitting a five-month low in all three counties.
Active inventory, year-over-year change by month
County | Apr | May | Jun | Jul | Aug |
|---|---|---|---|---|---|
Sarasota | −26.8% | −25.2% | −27.4% | −23.4% | −20.8% |
Manatee | −9.9% | −11.8% | −15.3% | −7.9% | −7.0% |
Charlotte | −28.5% | −26.5% | −31.2% | −25.0% | −24.4% |
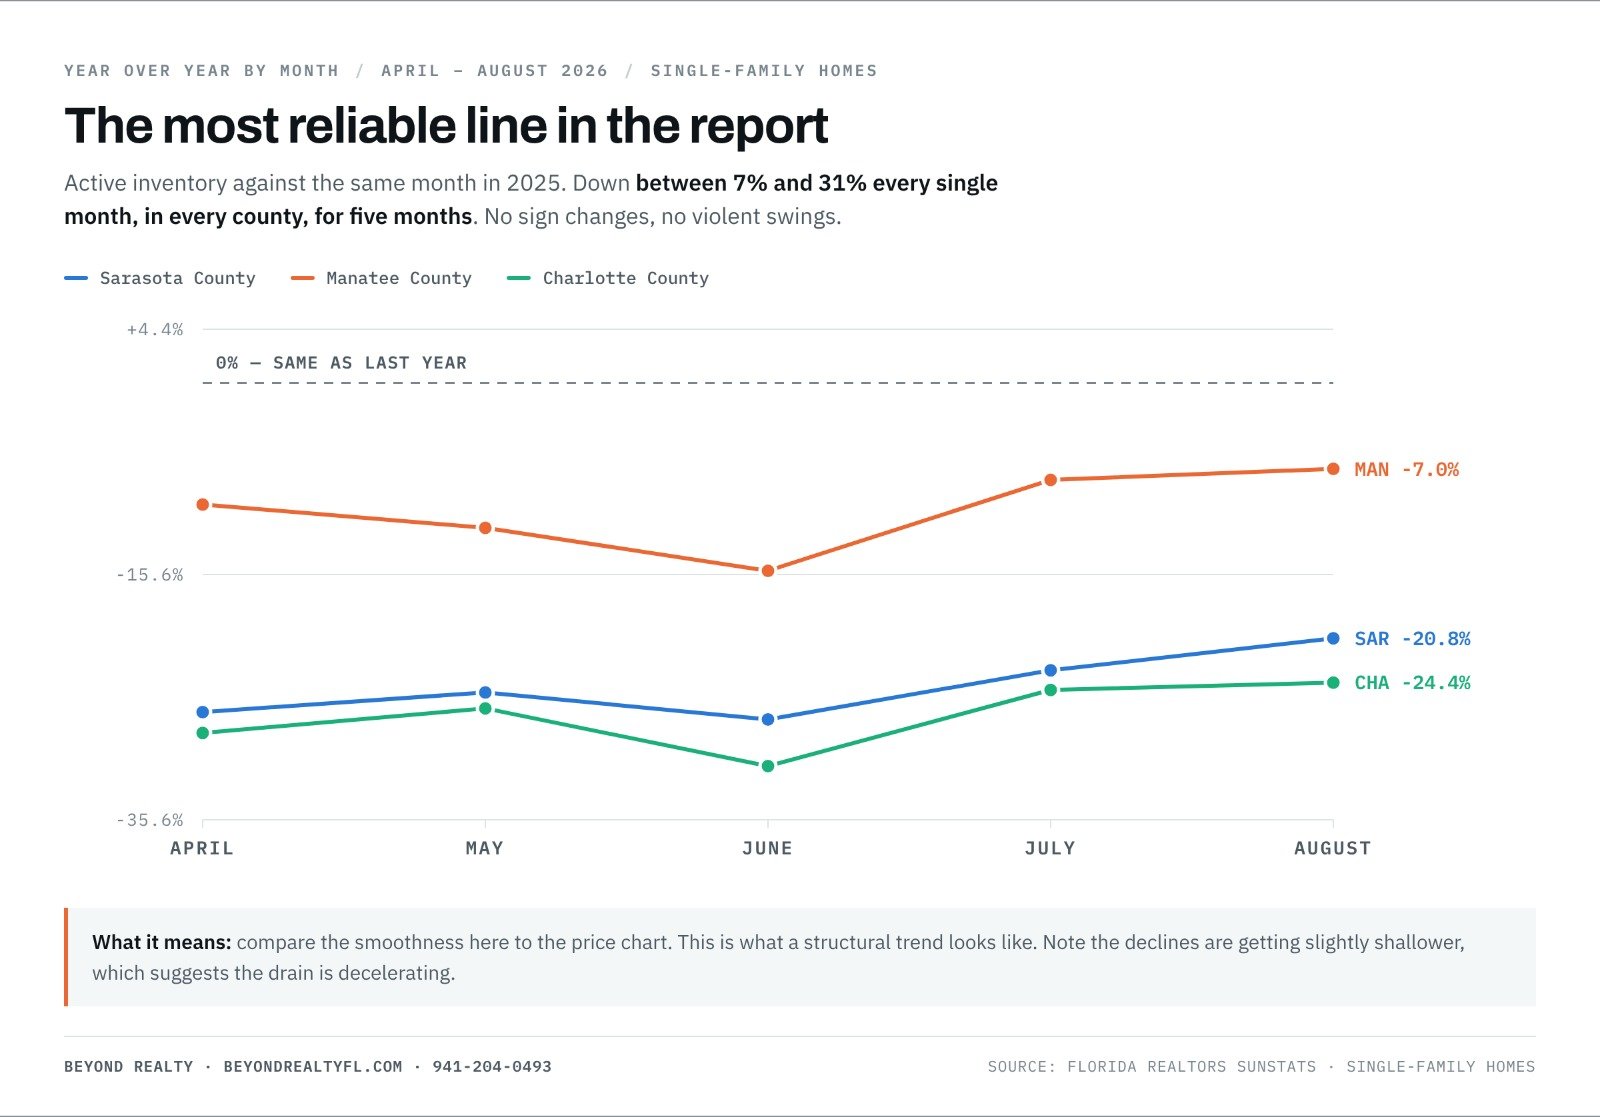
This table behaves completely differently from the price table, and that difference matters. Inventory has been down 20% to 31% every single month, in every county, for five consecutive months. There is no sign-flipping and no violent swinging. That is what a structural trend looks like, and it is the most reliable signal in this report. Worth noting: the declines are getting slightly shallower in all three counties, from roughly −27% in April to −21% in Sarasota, which suggests the inventory drain is decelerating even as it continues.
Median time to contract, year-over-year change by month (negative means faster)
County | Apr | May | Jun | Jul | Aug |
|---|---|---|---|---|---|
Sarasota | +7.0% | −2.0% | −21.7% | −17.5% | −31.9% |
Manatee | −12.0% | −9.6% | −19.6% | −13.8% | −15.1% |
Charlotte | 0.0% | −25.0% | −14.5% | −9.3% | −24.1% |
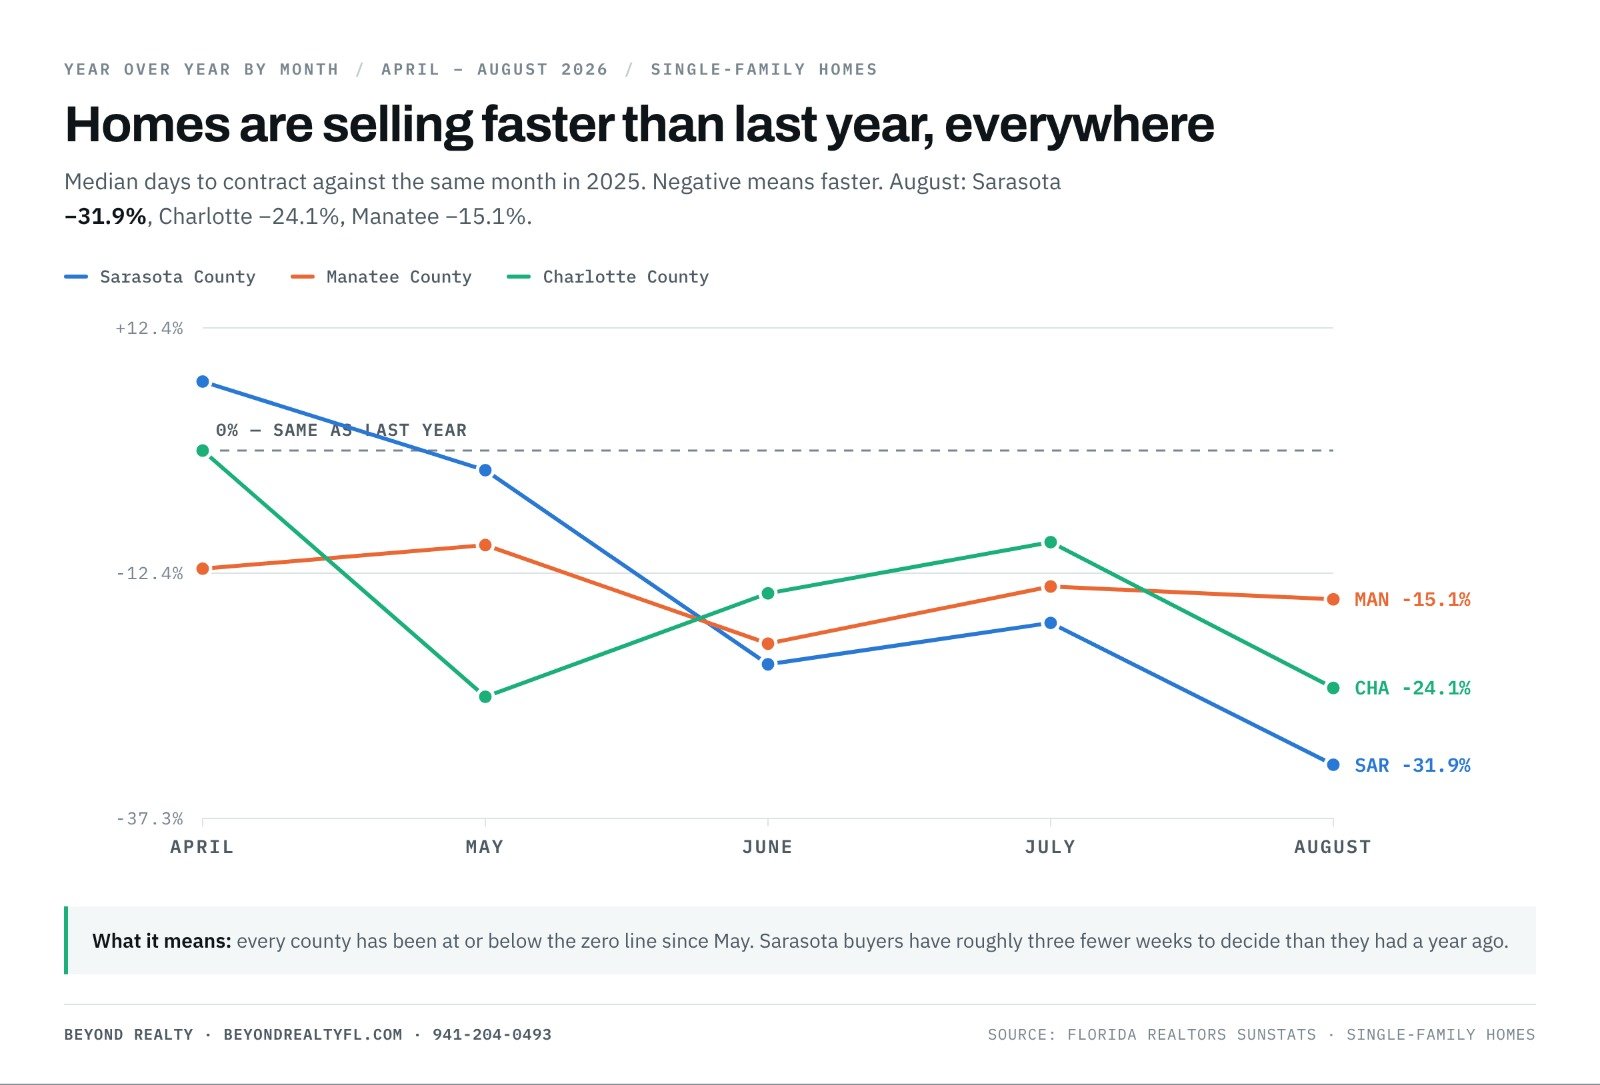
Negative means faster. Sarasota homes went under contract 31.9% quicker than last August.
Year-over-year comparisons answer "versus last year." Month-over-month levels answer "versus right now." Both are necessary.
Median Sale Price | Apr | May | Jun | Jul | Aug |
|---|---|---|---|---|---|
Sarasota | $490,000 | $475,000 | $492,450 | $493,500 | $470,000 |
Manatee | $492,500 | $460,000 | $490,000 | $495,000 | $495,000 |
Charlotte | $357,000 | $351,000 | $360,000 | $353,545 | $350,000 |
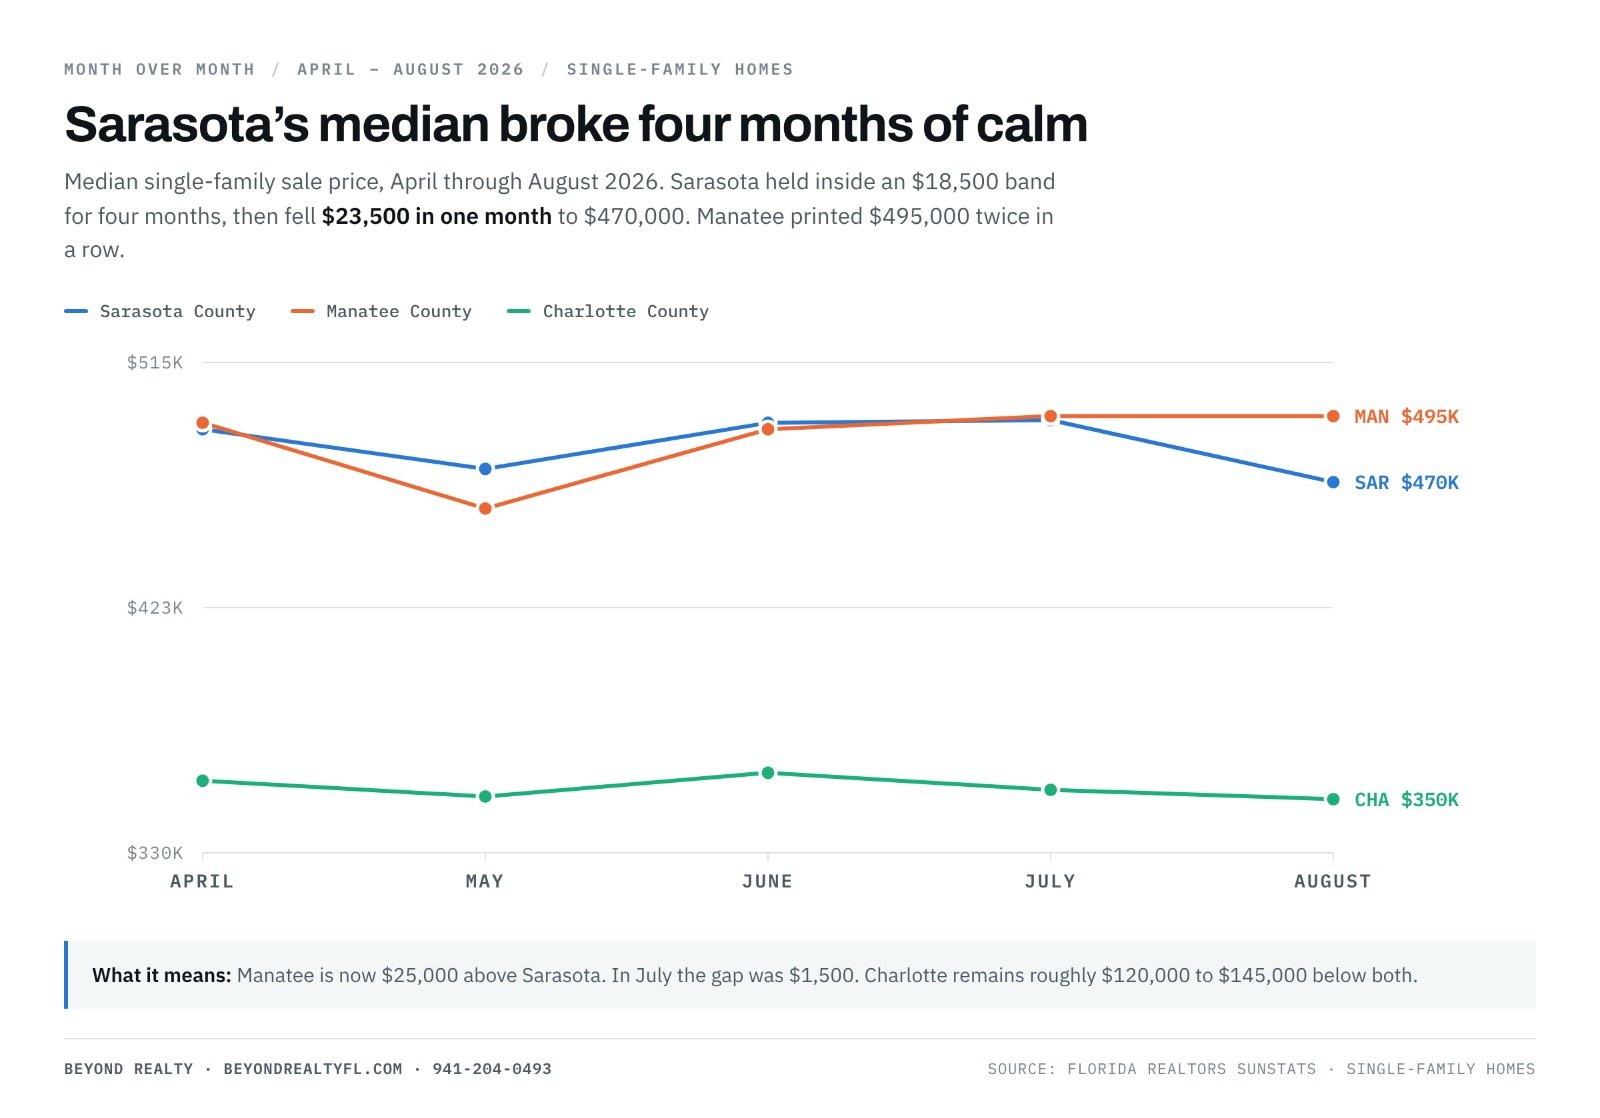
Manatee is now $25,000 above Sarasota. In July the gap was $1,500.
Months Supply | Apr | May | Jun | Jul | Aug |
|---|---|---|---|---|---|
Sarasota | 4.7 | 4.4 | 4.1 | 3.9 | 3.7 |
Manatee | 4.6 | 4.4 | 4.1 | 4.1 | 3.9 |
Charlotte | 6.1 | 5.9 | 5.1 | 5.0 | 4.7 |
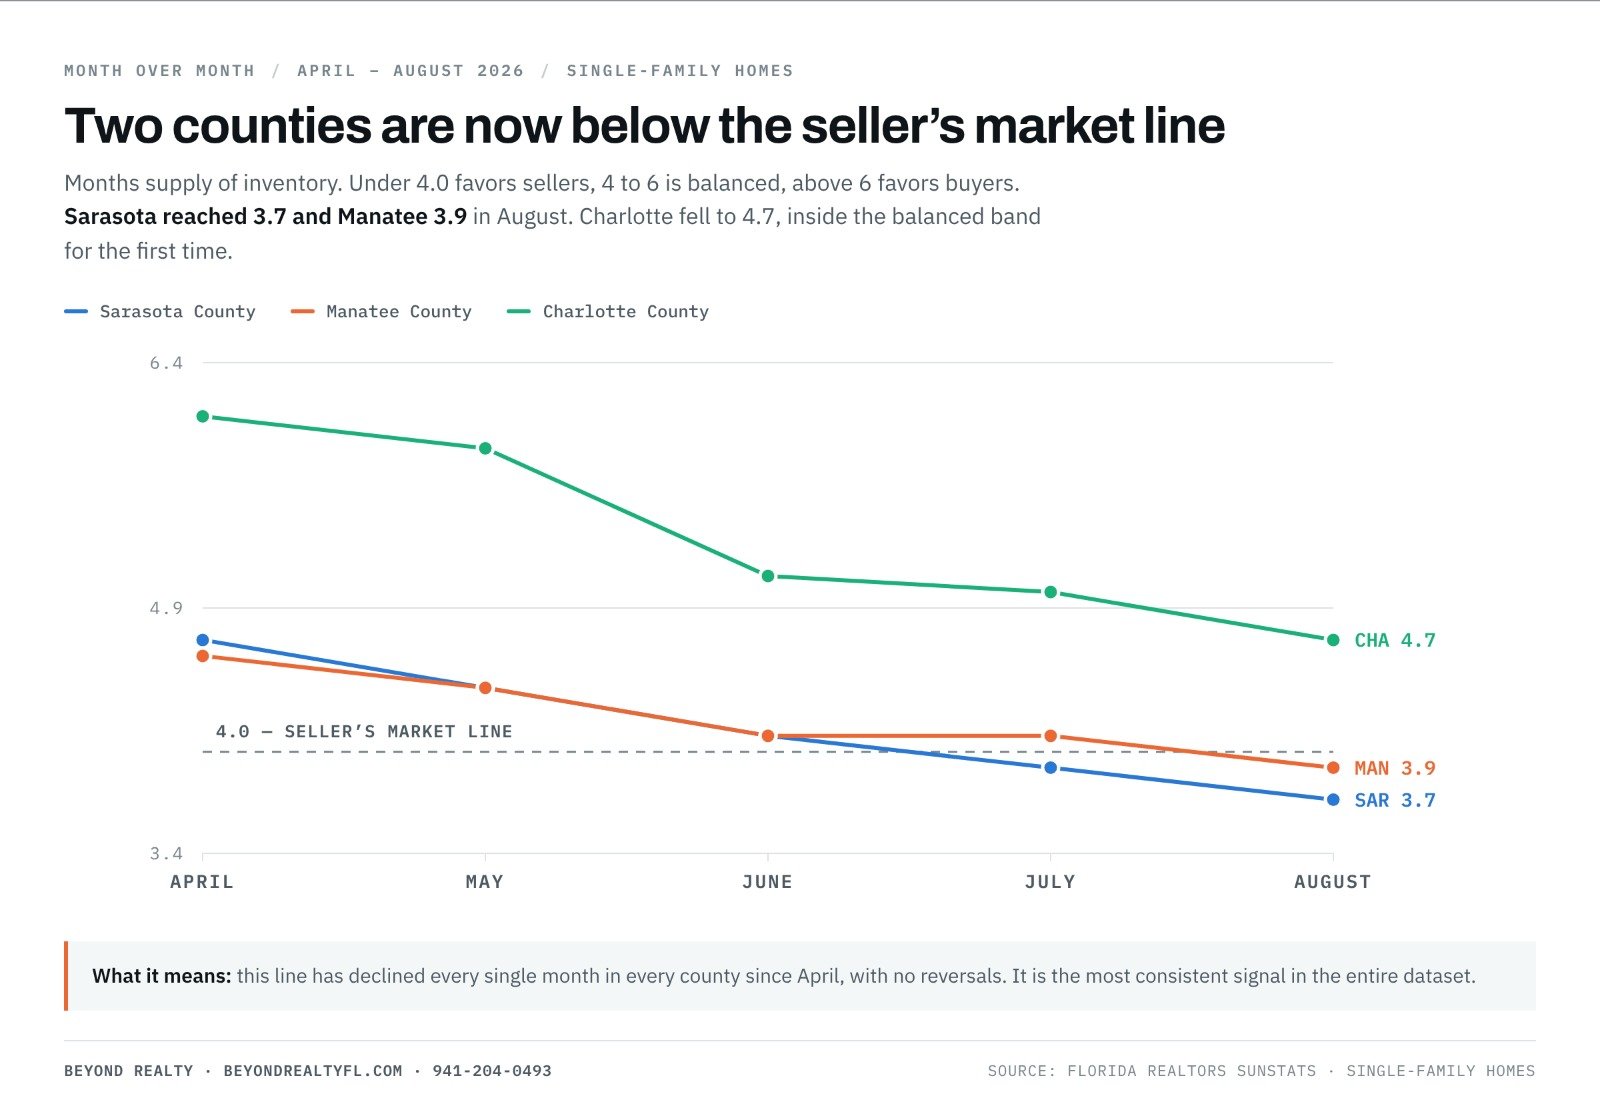
Two counties crossed below the four-month line in August. This line has declined every month in every county since April.
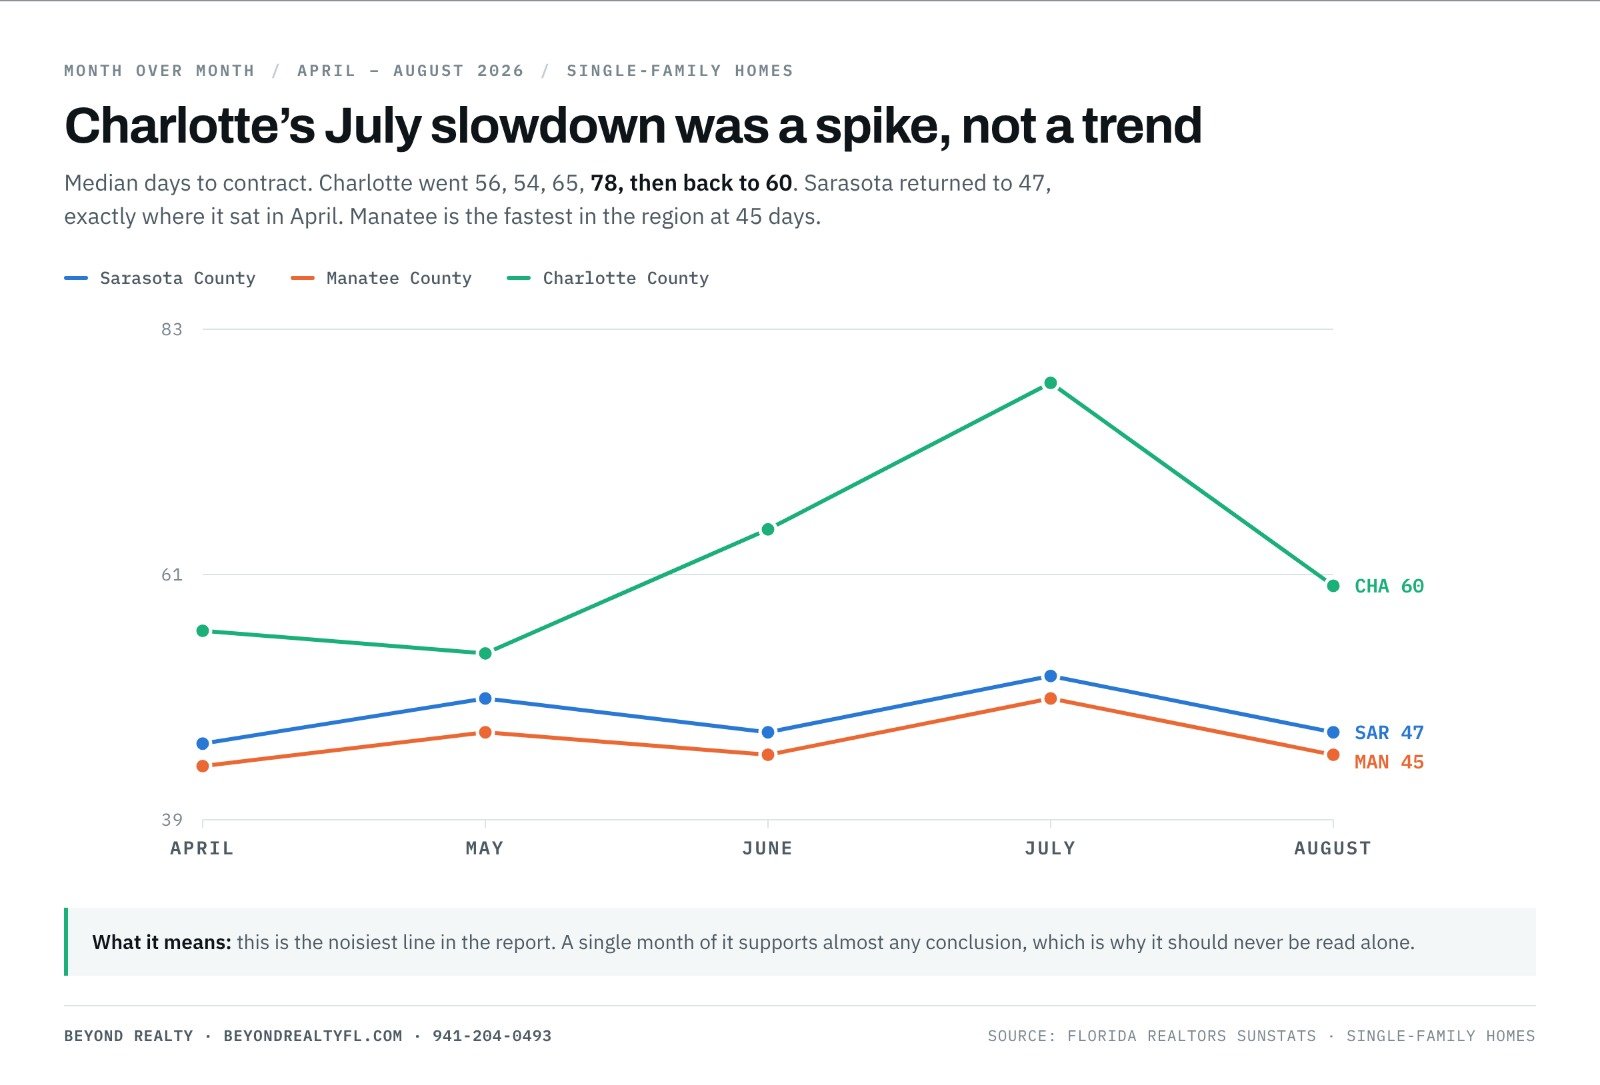
Median Days to Contract | Apr | May | Jun | Jul | Aug |
|---|---|---|---|---|---|
Sarasota | 46 | 50 | 47 | 52 | 47 |
Manatee | 44 | 47 | 45 | 50 | 45 |
Charlotte | 56 | 54 | 65 | 78 | 60 |
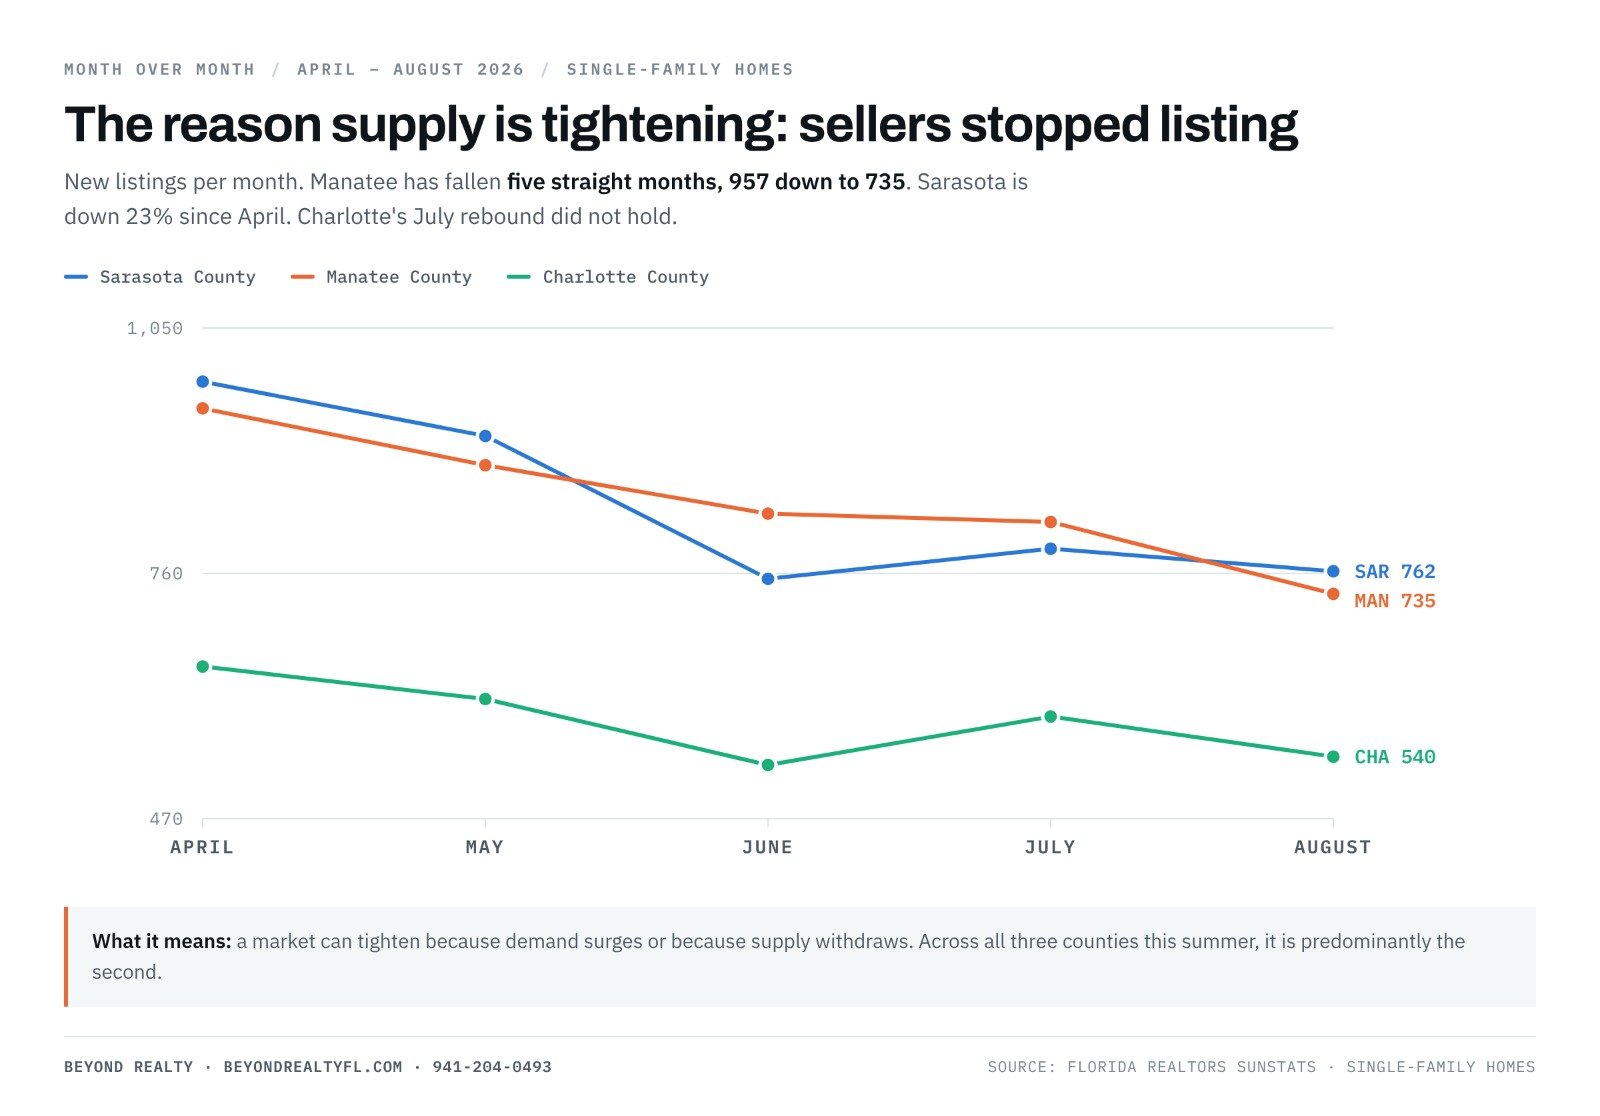
New Listings | Apr | May | Jun | Jul | Aug |
|---|---|---|---|---|---|
Sarasota | 989 | 924 | 753 | 789 | 762 |
Manatee | 957 | 889 | 831 | 821 | 735 |
Charlotte | 648 | 609 | 530 | 588 | 540 |
Three conclusions follow directly:
The negative national coverage of Florida real estate gained one genuine data point in August 2026, and lost several others. Sarasota County's median sale price did decline 1.1% year over year. That is real and it deserves to be reported plainly.
What the same report also shows: active inventory fell in all three counties, months supply reached its lowest point of the year in all three, median percent of original list price rose in all three, and homes sold faster in all three. A declining market does not produce that combination.
To be fair to the headlines, much of the negative coverage is driven by two things that are real but not representative of our single-family market. First, statewide averages get dragged by the condo segment, which faces its own well-documented insurance and assessment challenges. Second, national outlets compare today to the 2021–2022 frenzy rather than to a healthy baseline. You can verify the statewide picture through the Florida Realtors® research and statistics portal.
Here is what the August single-family data actually shows:
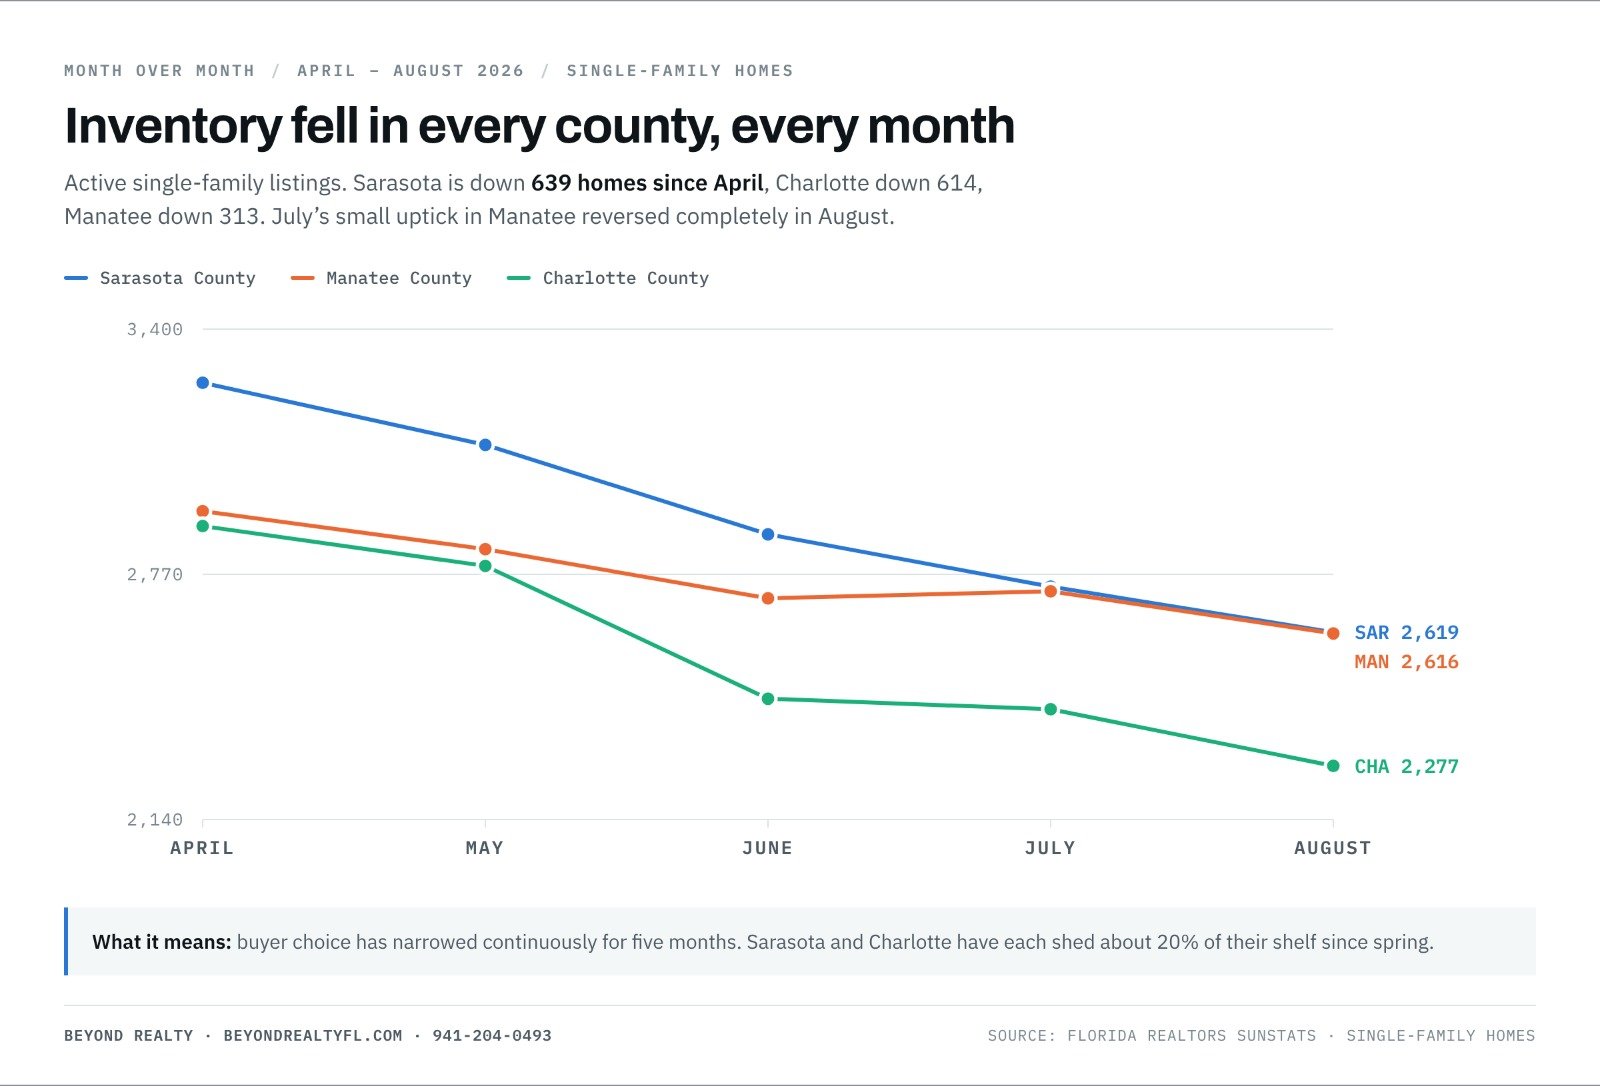 Sarasota has shed 639 homes from its shelf since April.
Sarasota County's median single-family sale price fell 1.1% year over year to $470,000 in August 2026, the first year-over-year decline in this series, while months supply fell to 3.7, the tightest reading of the year. Homes went under contract in 47 days against 69 a year earlier, a 31.9% improvement and the largest speed gain in the region. Sellers kept 94.7% of original list price, the strongest figure of the last five months.
Sarasota County (Single-Family) | Apr | May | Jun | Jul | Aug 2026 | Aug 2025 | Y/Y |
|---|---|---|---|---|---|---|---|
Closed Sales | 824 | 845 | 805 | 744 | 646 | 641 | +0.8% |
Median Sale Price | $490,000 | $475,000 | $492,450 | $493,500 | $470,000 | $475,000 | −1.1% |
Average Sale Price | $814,685 | $673,741 | $732,527 | $764,307 | $670,413 | $683,604 | −1.9% |
Dollar Volume | $671.3M | $569.3M | $589.7M | $568.6M | $433.1M | $438.2M | −1.2% |
Median % of Original List | 94.3% | 94.2% | 94.4% | 94.2% | 94.7% | 92.3% | +2.6% |
Median Time to Contract | 46 days | 50 days | 47 days | 52 days | 47 days | 69 days | −31.9% |
New Listings | 989 | 924 | 753 | 789 | 762 | 736 | +3.5% |
New Pending Sales | 874 | 808 | 686 | 724 | 665 | 658 | +1.1% |
Active Inventory | 3,258 | 3,099 | 2,870 | 2,736 | 2,619 | 3,307 | −20.8% |
Months Supply | 4.7 | 4.4 | 4.1 | 3.9 | 3.7 | 5.2 | −28.8% |
Cash Sales (% of closed) | 43.9% | 42.0% | 39.0% | 33.6% | 37.3% | 36.3% | n/a |
What stands out: the median and the average fell together, by 1.1% and 1.9% respectively, while closed sales rose 0.8%. When both central measures decline on higher volume, the likeliest explanation is a shift in the composition of what sold rather than a markdown on comparable homes. That reading cannot be proven from county-level data alone; price-band and neighborhood data is what would confirm or refute it. What can be said is that a market genuinely repricing downward would not simultaneously post its fastest sales and strongest percent-of-list in five months. You can browse current availability on our active Sarasota-area listings page.
Manatee County's months supply fell to 3.9 in August 2026 from 4.6 a year earlier, crossing below the seller's-market threshold, while the median sale price held at $495,000 for a second consecutive month, up 5.9% year over year. Closed sales rose 5.7% to 687 and dollar volume rose 5.4% to $456.1 million. Homes went under contract in 45 days, the fastest in the region, and sellers kept 95.6% of original list price, also the regional best.
Manatee County (Single-Family) | Apr | May | Jun | Jul | Aug 2026 | Aug 2025 | Y/Y |
|---|---|---|---|---|---|---|---|
Closed Sales | 704 | 782 | 890 | 694 | 687 | 650 | +5.7% |
Median Sale Price | $492,500 | $460,000 | $490,000 | $495,000 | $495,000 | $467,640 | +5.9% |
Average Sale Price | $760,094 | $667,503 | $648,560 | $675,943 | $663,878 | $665,577 | −0.3% |
Dollar Volume | $535.1M | $522.0M | $577.2M | $469.1M | $456.1M | $432.6M | +5.4% |
Median % of Original List | 94.6% | 95.4% | 95.8% | 95.2% | 95.6% | 94.8% | +0.8% |
Median Time to Contract | 44 days | 47 days | 45 days | 50 days | 45 days | 53 days | −15.1% |
New Listings | 957 | 889 | 831 | 821 | 735 | 763 | −3.7% |
New Pending Sales | 821 | 839 | 716 | 653 | 665 | 637 | +4.4% |
Active Inventory | 2,929 | 2,832 | 2,706 | 2,724 | 2,616 | 2,814 | −7.0% |
Months Supply | 4.6 | 4.4 | 4.1 | 4.1 | 3.9 | 4.6 | −15.2% |
Cash Sales (% of closed) | 32.8% | 27.0% | 25.2% | 27.7% | 26.6% | 28.5% | n/a |
What stands out: the four-month slide in new pending sales that looked concerning in July reversed, rising to 665 and turning positive year over year at +4.4%. The median landing on exactly $495,000 for two consecutive months suggests a market that has found its clearing price. The genuine caution is new listings, down 3.7% year over year and down 23% across five months from 957 in April. Manatee's tightening is being driven substantially by seller withdrawal rather than a demand surge, and those two mechanisms do not age the same way. If you're weighing the master-planned corridor east of I-75, start with our Lakewood Ranch community guide.
Charlotte County's median time to contract fell to 60 days in August 2026 from 78 in July, and median percent of original list price jumped to 94.4% from 93.0%, the largest single-month move on that line all year. Months supply fell to 4.7 from 7.1 a year earlier. At the same time, closed sales fell 2.4% to 448, the first negative reading in this series, with new listings down 10.4% and new pending sales down 7.6%.
Charlotte County (Single-Family) | Apr | May | Jun | Jul | Aug 2026 | Aug 2025 | Y/Y |
|---|---|---|---|---|---|---|---|
Closed Sales | 531 | 562 | 537 | 528 | 448 | 459 | −2.4% |
Median Sale Price | $357,000 | $351,000 | $360,000 | $353,545 | $350,000 | $345,000 | +1.4% |
Average Sale Price | $420,379 | $439,145 | $431,485 | $443,931 | $419,907 | $408,811 | +2.7% |
Dollar Volume | $223.2M | $246.8M | $231.7M | $234.4M | $188.1M | $187.6M | +0.3% |
Median % of Original List | 93.2% | 93.8% | 93.6% | 93.0% | 94.4% | 91.1% | +3.6% |
Median Time to Contract | 56 days | 54 days | 65 days | 78 days | 60 days | 79 days | −24.1% |
New Listings | 648 | 609 | 530 | 588 | 540 | 603 | −10.4% |
New Pending Sales | 577 | 546 | 554 | 479 | 472 | 511 | −7.6% |
Active Inventory | 2,891 | 2,789 | 2,449 | 2,422 | 2,277 | 3,013 | −24.4% |
Months Supply | 6.1 | 5.9 | 5.1 | 5.0 | 4.7 | 7.1 | −33.8% |
Cash Sales (% of closed) | 40.9% | 44.7% | 37.1% | 38.3% | 34.2% | 35.7% | n/a |
What stands out: Charlotte remains the region's affordability play at a $350,000 median, roughly $120,000 below Sarasota and $145,000 below Manatee. But the buyer leverage that defined this county for two years eroded sharply in a single month. The honest caveat is the mechanism: this tightening came with falling sales, falling listings, and falling pending contracts. Supply is draining from both ends. That is scarcity rather than a demand boom, and it means correct pricing matters more here than in a busy market, because there is no volume of traffic to rescue an overpriced listing.
Buyer leverage narrowed measurably in August 2026 in all three counties, and the headline about Sarasota's falling median does not change that. Months supply hit yearly lows everywhere, homes sold 15% to 32% faster than a year ago, and sellers kept more of their asking price in every county.
August 2026 delivered the strongest seller position of the year across all three counties, into the thinnest competition in two years and a smaller pool of active buyers. That combination rewards correct pricing more than a busy market does, because when the price is wrong there is no volume of traffic to compensate.
Southwest Florida's single-family market entered fall 2026 with two counties in seller's-market territory, the tightest inventory of the year in all three, the fastest sales in all three, the strongest seller pricing power in all three, and a five-month low in closed sales in all three. Sarasota's median price turned negative for the first time while that county simultaneously posted its best leverage numbers of the year, which is the clearest illustration available of why a single statistic should never drive a decision. The reliable signal in this dataset is months supply, which has declined every month in every county without a reversal. The unreliable one is any single month's year-over-year price change. Act on hyper-local data, and on the lines that move smoothly rather than the ones that spike.
Data source: Florida Realtors® SunStats (April through August 2026 monthly indicators, single-family homes, Charlotte, Sarasota, and Manatee counties). For statewide context and methodology, see the Florida Realtors® research portal. Statistics reflect MLS-reported closed transactions and are subject to revision.
Are Sarasota home prices going down in 2026? The median single-family sale price fell 1.1% year over year in August 2026, to $470,000 from $475,000. That is the first negative year-over-year median in this series. The average sale price also fell, down 1.9% to $670,413, which points to a change in the mix of homes sold rather than a broad markdown on comparable properties.
Why did Sarasota's median price fall while homes sold faster? Those two figures measure different things. The median reflects what happened to close in a given month; sales speed reflects demand against available supply. When fewer high-end homes close, the median falls even though individual homes are selling quickly. In August 2026 Sarasota homes went under contract in a median of 47 days, down from 69 a year earlier, while months supply hit a yearly low of 3.7.
Is Sarasota a buyer's market or a seller's market in 2026? A seller's market. Months supply was 3.7 in August 2026, the second consecutive month below the four-month line and down from 5.2 a year earlier.
Is Manatee County a seller's market? Yes, as of August 2026. Months supply fell to 3.9 from 4.6 a year earlier, crossing below the four-month threshold for the first time in this series.
Is Manatee County more expensive than Sarasota County? Yes. Manatee's median single-family price was $495,000 in August 2026 against Sarasota's $470,000, a gap of $25,000. In July the gap was $1,500, so it widened substantially in one month.
Is Punta Gorda still a buyer's market in 2026? Barely. Charlotte County months supply fell to 4.7 in August 2026 from 7.1 a year earlier, median days to contract fell to 60 from 79, and sellers now keep 94.4% of original list price versus 91.1% a year ago.
Where is the most affordable place to buy a single-family home on the Gulf Coast? Charlotte County, at a $350,000 median in August 2026, roughly $120,000 below Sarasota and $145,000 below Manatee. It also offers the longest negotiating window at 60 days to contract.
How long does it take to sell a house in Southwest Florida? In August 2026, the median time to contract was 45 days in Manatee County, 47 days in Sarasota County, and 60 days in Charlotte County. Add roughly six to seven weeks from contract to closing.
Is the Southwest Florida housing market slowing down? Transaction volume is, while leverage is moving toward sellers. Closed sales hit a five-month low in all three counties in August 2026, and the tri-county total of 1,781 sales was up only 1.8% from a year earlier. At the same time, months supply reached yearly lows and sellers kept more of their asking price in every county. Fewer homes are selling, and the ones that do are selling faster and closer to asking price.
Why is inventory falling in Southwest Florida? Primarily because fewer owners are listing. New listings fell year over year in Manatee (−3.7%) and Charlotte (−10.4%) in August 2026, and across five months new listings are down roughly 23% in both Sarasota and Manatee. Active inventory has been down 20% to 31% year over year every month since April.
Have questions about what these numbers mean for your street, your neighborhood, or your timeline? That's exactly the conversation we love to have: no pressure, just data and straight answers. Reach out directly, browse our current listings, or request your free home valuation.
Beyond Realty 2170 Main Street, Suite 103 Sarasota, FL 34237 Phone: 941-204-0493
Darren Dowling is a Sarasota-based real estate broker-owner specializing in Sarasota and Lakewood Ranch residential real estate, new construction, and relocation.

How VA Home Loan Benefits, More Negotiating Opportunities, and Local Real Estate Market Conditions Could Help Veterans and Active-Duty Service Members Buy a Home in Sa… Read more

What Buyers and Sellers Need to Know About Mortgage Rates, Home Values, and Real Estate Market Trends in Sarasota, Lakewood Ranch, Manatee County, and Charlotte County.
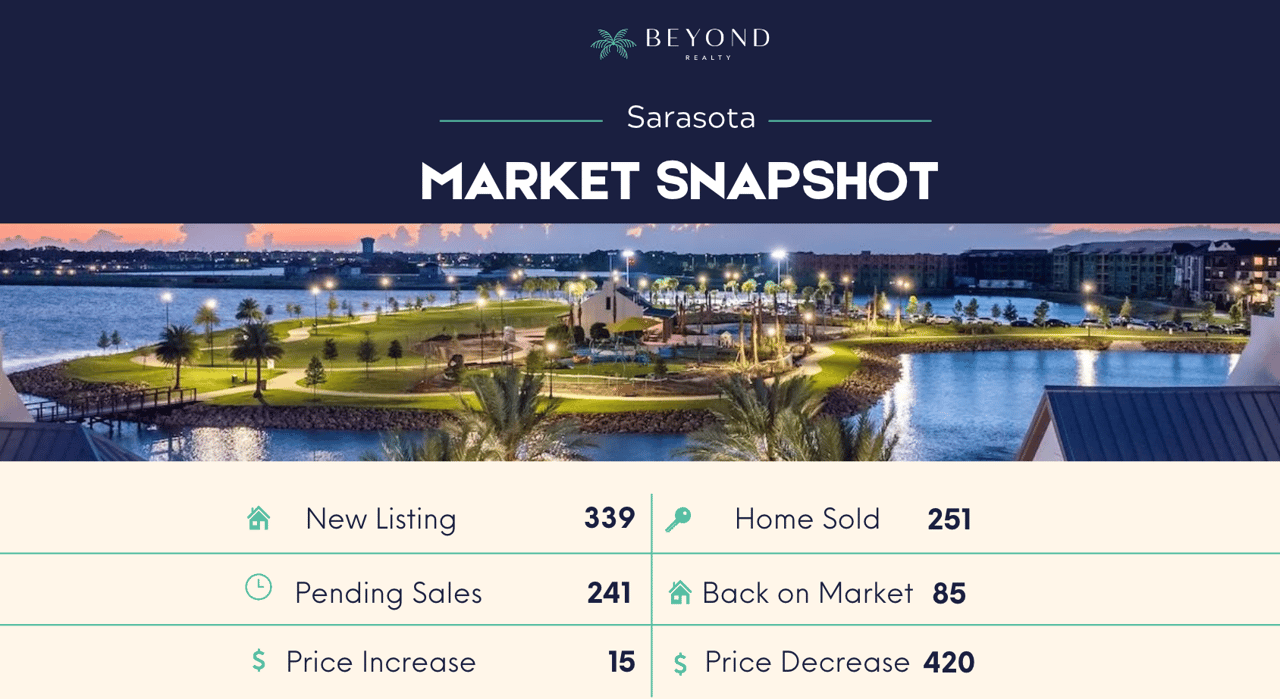
Closed Sales and Pending Activity Rise in Sarasota County as Pricing Adjustments Continue Across Both Markets

You’ve got questions and we can’t wait to answer them.