Southwest Florida Housing Market Report, September 2026: The Inventory Squeeze Just Ended
Darren Dowling
Darren Dowling
Published October 2026 | Single-family home data from Florida Realtors® SunStats | Sarasota, Manatee & Charlotte Counties
Quick answer: In September 2026, months supply of inventory stopped falling in all three Southwest Florida counties for the first time since April, and new listings rose year over year in all three. Sarasota County held at 3.7 months, Manatee County held at 3.9, and Charlotte County rose from 4.7 to 4.9. The five-month inventory squeeze that defined this market through the summer has ended.
That is the headline, and it is the first genuine change in direction this market has produced all year. The second headline is stranger: Sarasota County's average sale price jumped 52.5% to $985,116 while its median rose a normal 7.8% to $485,000. This report explains both, and why the second one is a lesson in how to read housing data rather than a reason to celebrate.
Source: Florida Realtors® SunStats, single-family homes, September 2026.
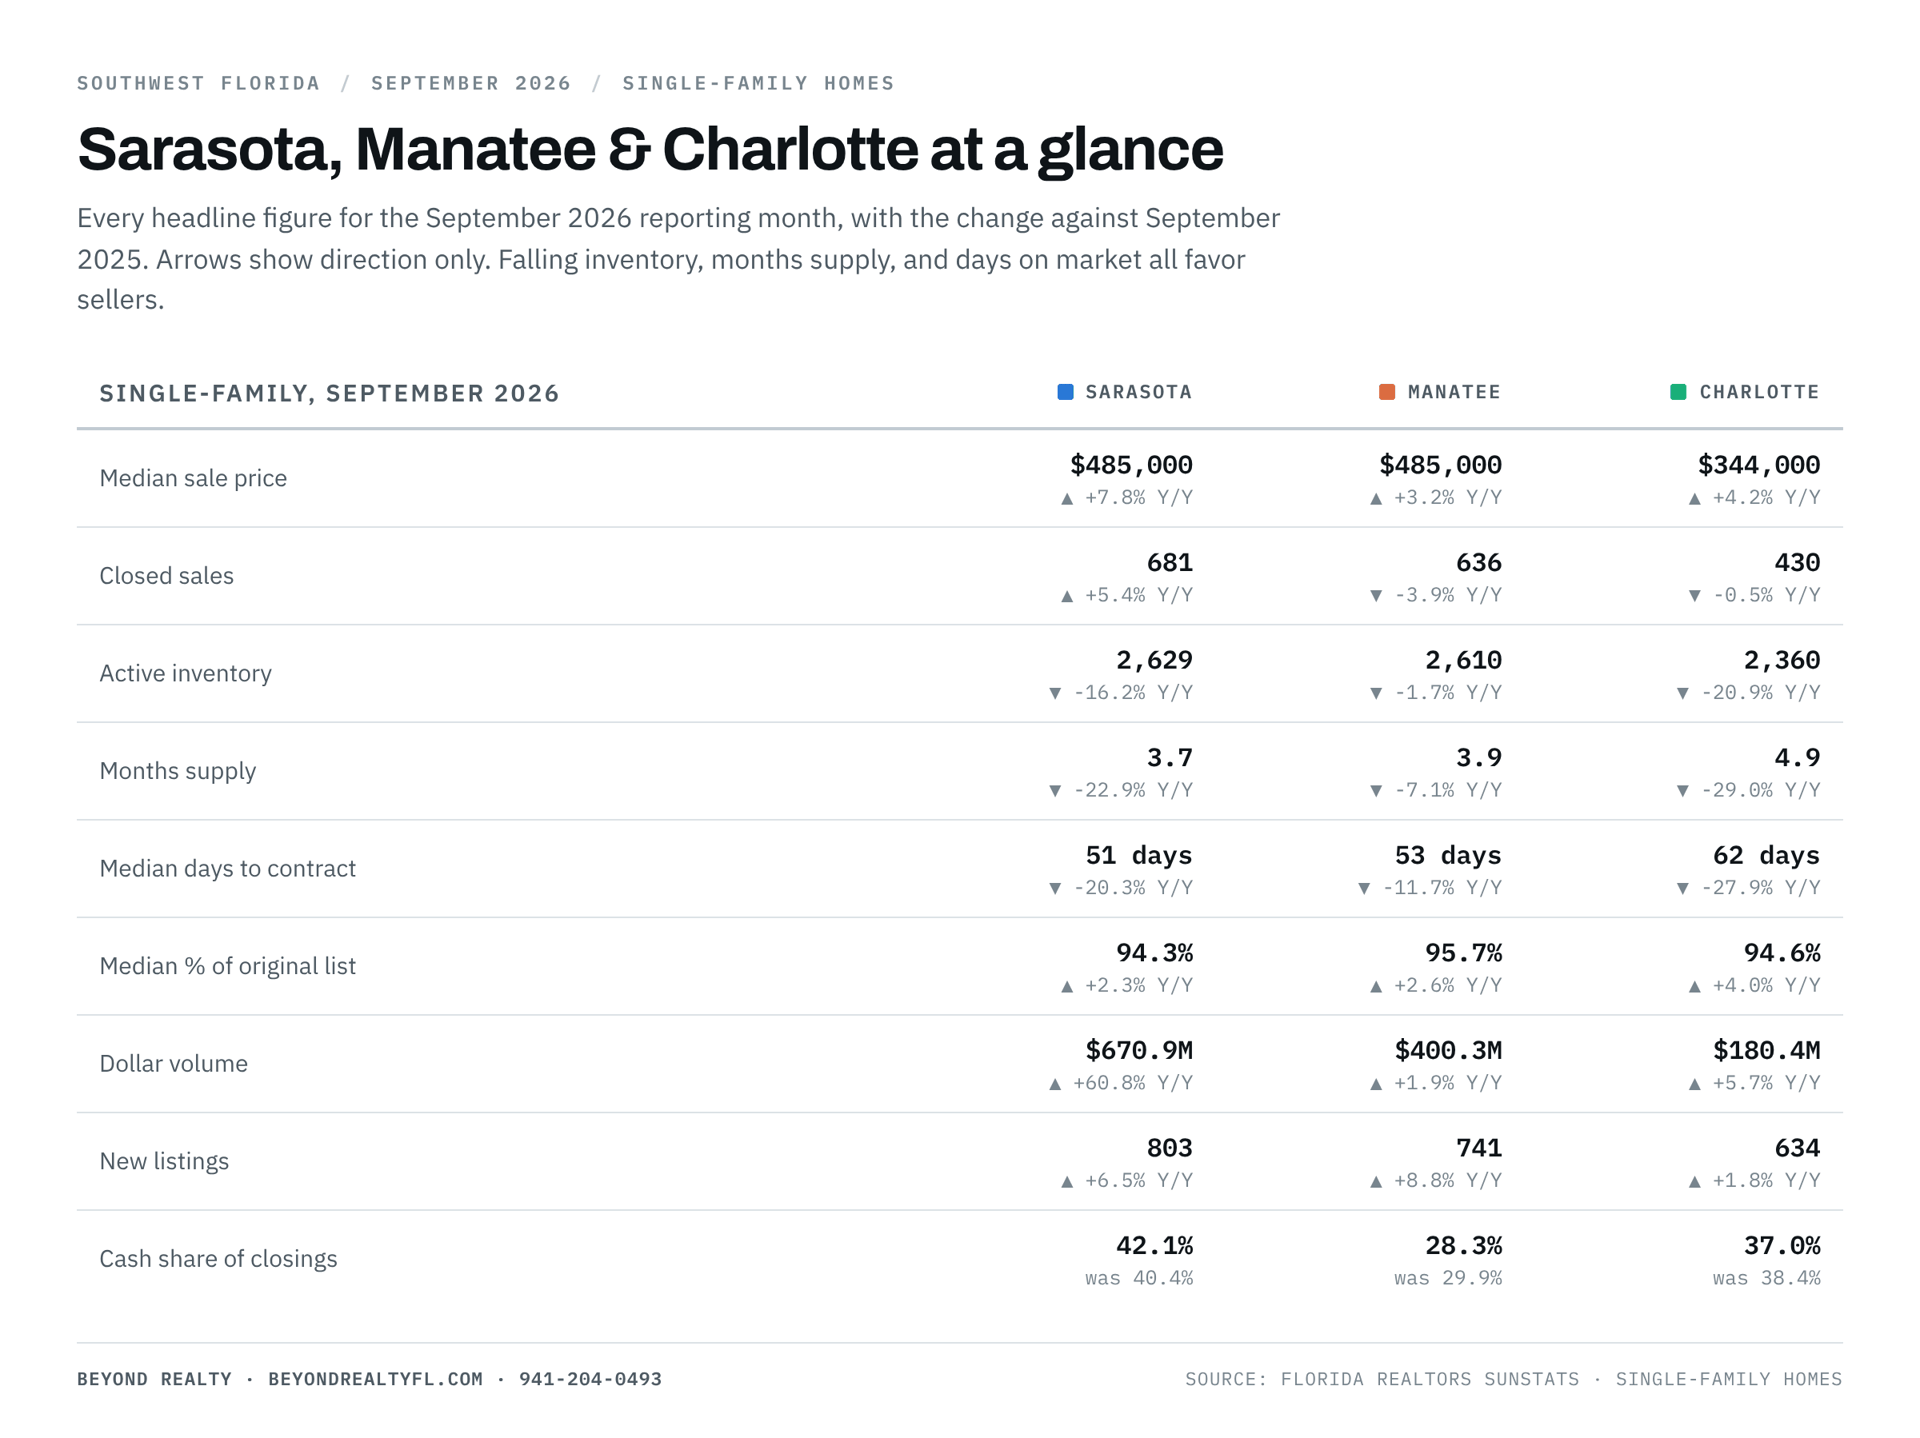
Metric (Single-Family, Sept 2026 vs. Sept 2025) | Sarasota | Manatee | Charlotte |
|---|---|---|---|
Median Sale Price | $485,000 (+7.8%) | $485,000 (+3.2%) | $344,000 (+4.2%) |
Average Sale Price | $985,116 (+52.5%) | $629,444 (+6.1%) | $419,599 (+6.3%) |
Closed Sales | 681 (+5.4%) | 636 (−3.9%) | 430 (−0.5%) |
Dollar Volume | $670.9M (+60.8%) | $400.3M (+2.0%) | $180.4M (+5.8%) |
Active Inventory | 2,629 (−16.2%) | 2,610 (−1.7%) | 2,360 (−20.9%) |
Months Supply | 3.7 (was 4.8) | 3.9 (was 4.2) | 4.9 (was 6.9) |
Median Time to Contract | 51 days (−20.3%) | 53 days (−11.7%) | 62 days (−27.9%) |
Median % of Original List | 94.3% | 95.7% | 94.6% |
New Listings | 803 (+6.5%) | 741 (+8.8%) | 634 (+1.8%) |
Cash Share of Closings | 42.1% | 28.3% | 37.0% |
The decline has stopped, but inventory remains far below year-ago levels. Active listings are still down 16.2% in Sarasota, 20.9% in Charlotte, and 1.7% in Manatee compared to September 2025. What changed in September is the direction: after five consecutive months of falling supply in every county, active inventory rose in Sarasota (2,619 to 2,629) and Charlotte (2,277 to 2,360) and was essentially flat in Manatee.
This matters more than any single price figure, because months supply is the number that determines who holds leverage in a negotiation. Here is the full six-month picture:
Months Supply of Inventory | Apr | May | Jun | Jul | Aug | Sep |
|---|---|---|---|---|---|---|
Sarasota | 4.7 | 4.4 | 4.1 | 3.9 | 3.7 | 3.7 |
Manatee | 4.6 | 4.4 | 4.1 | 4.1 | 3.9 | 3.9 |
Charlotte | 6.1 | 5.9 | 5.1 | 5.0 | 4.7 | 4.9 |
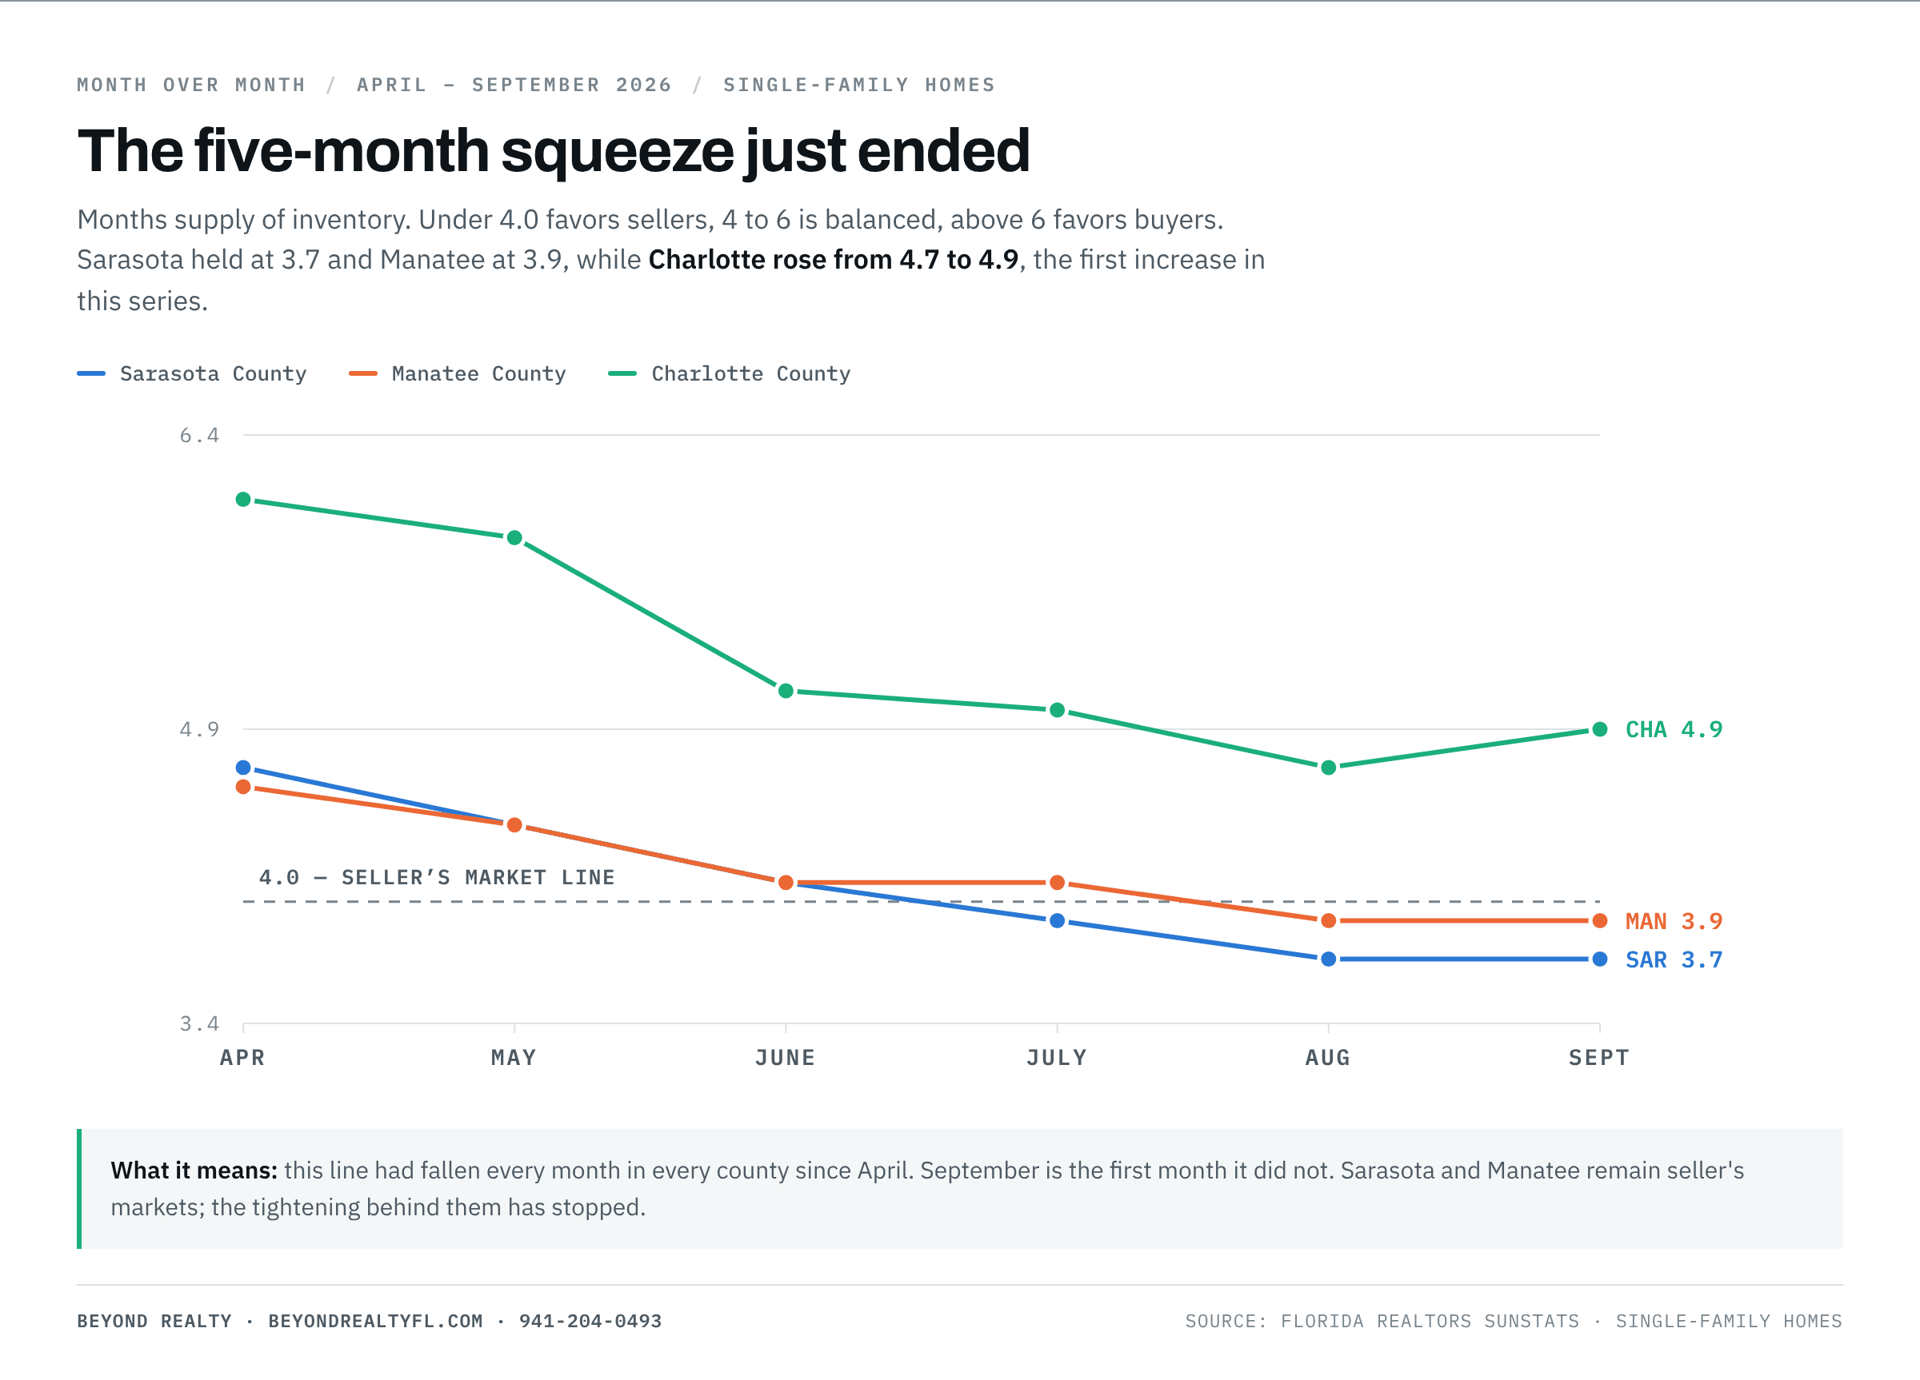
For context on what these numbers mean: under 4.0 months of supply is conventionally a seller's market, 4.0 to 6.0 is balanced, and above 6.0 favors buyers. Sarasota and Manatee remain in seller's territory. Charlotte moved slightly back toward the middle of the balanced band.
The cause is visible in the new listings data. Sellers had been withdrawing all summer, which is what drove the squeeze. In September they returned:
New Listings | Apr | May | Jun | Jul | Aug | Sep |
|---|---|---|---|---|---|---|
Sarasota | 989 | 924 | 753 | 789 | 762 | 803 |
Manatee | 957 | 889 | 831 | 821 | 735 | 741 |
Charlotte | 648 | 609 | 530 | 588 | 540 | 634 |
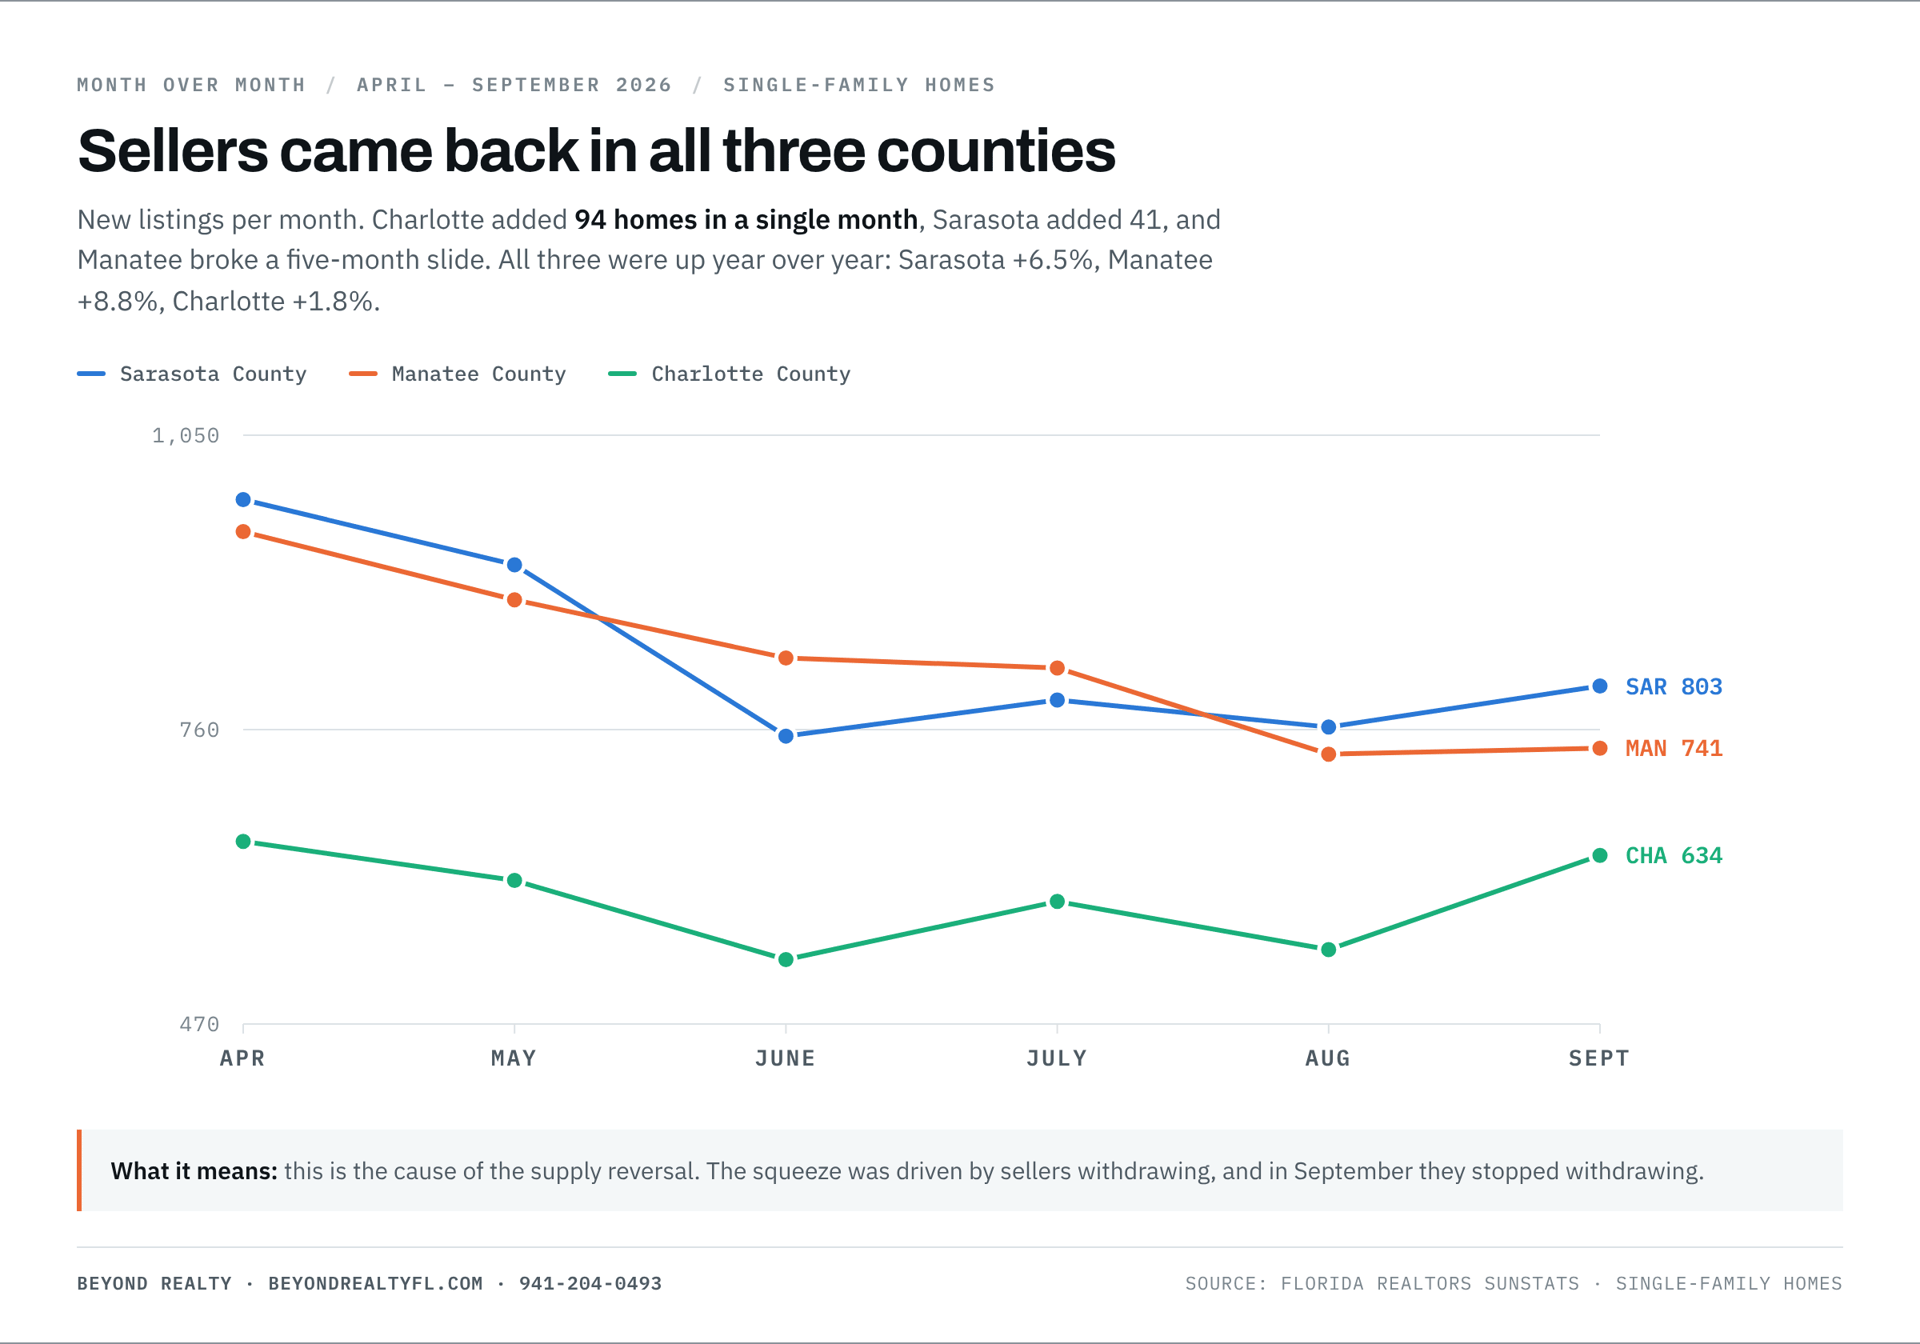
Manatee's figure is the most notable. New listings there had fallen for five consecutive months, from 957 in April to 735 in August. September broke that streak, and at +8.8% year over year it was the largest annual gain of the three counties.
Because a small number of very expensive homes closed in September, which pulls the average far more than it pulls the median. Sarasota County's average single-family sale price was $985,116 in September 2026, against $645,845 a year earlier. Over the same period the median rose from $450,000 to $485,000, a 7.8% gain.
This is the single most useful teaching example this market has produced all year, so it is worth being precise about the difference:
In September 2025, Sarasota's average was 1.44 times its median. In September 2026 it was 2.03 times. That ratio nearly doubling in twelve months tells you the top of the market was unusually active, not that homes broadly became 52% more expensive. Dollar volume tells the same story: it rose 60.8% to $670.9 million on only 5.4% more closings.
The practical implication: if you own a typical home in Sarasota County, the 7.8% median gain describes your situation and the 52.5% average gain does not. Any headline leading with the average number this month is misleading you, whether or not it intends to.
This also resolves a question from last month's report. In August, Sarasota's median fell 1.1% while that county posted its tightest inventory and fastest sales of the year. We argued then that the decline reflected a change in which homes sold rather than a decline in value, and noted that a recovery in the average price would confirm it. September delivered exactly that, in both directions at once.
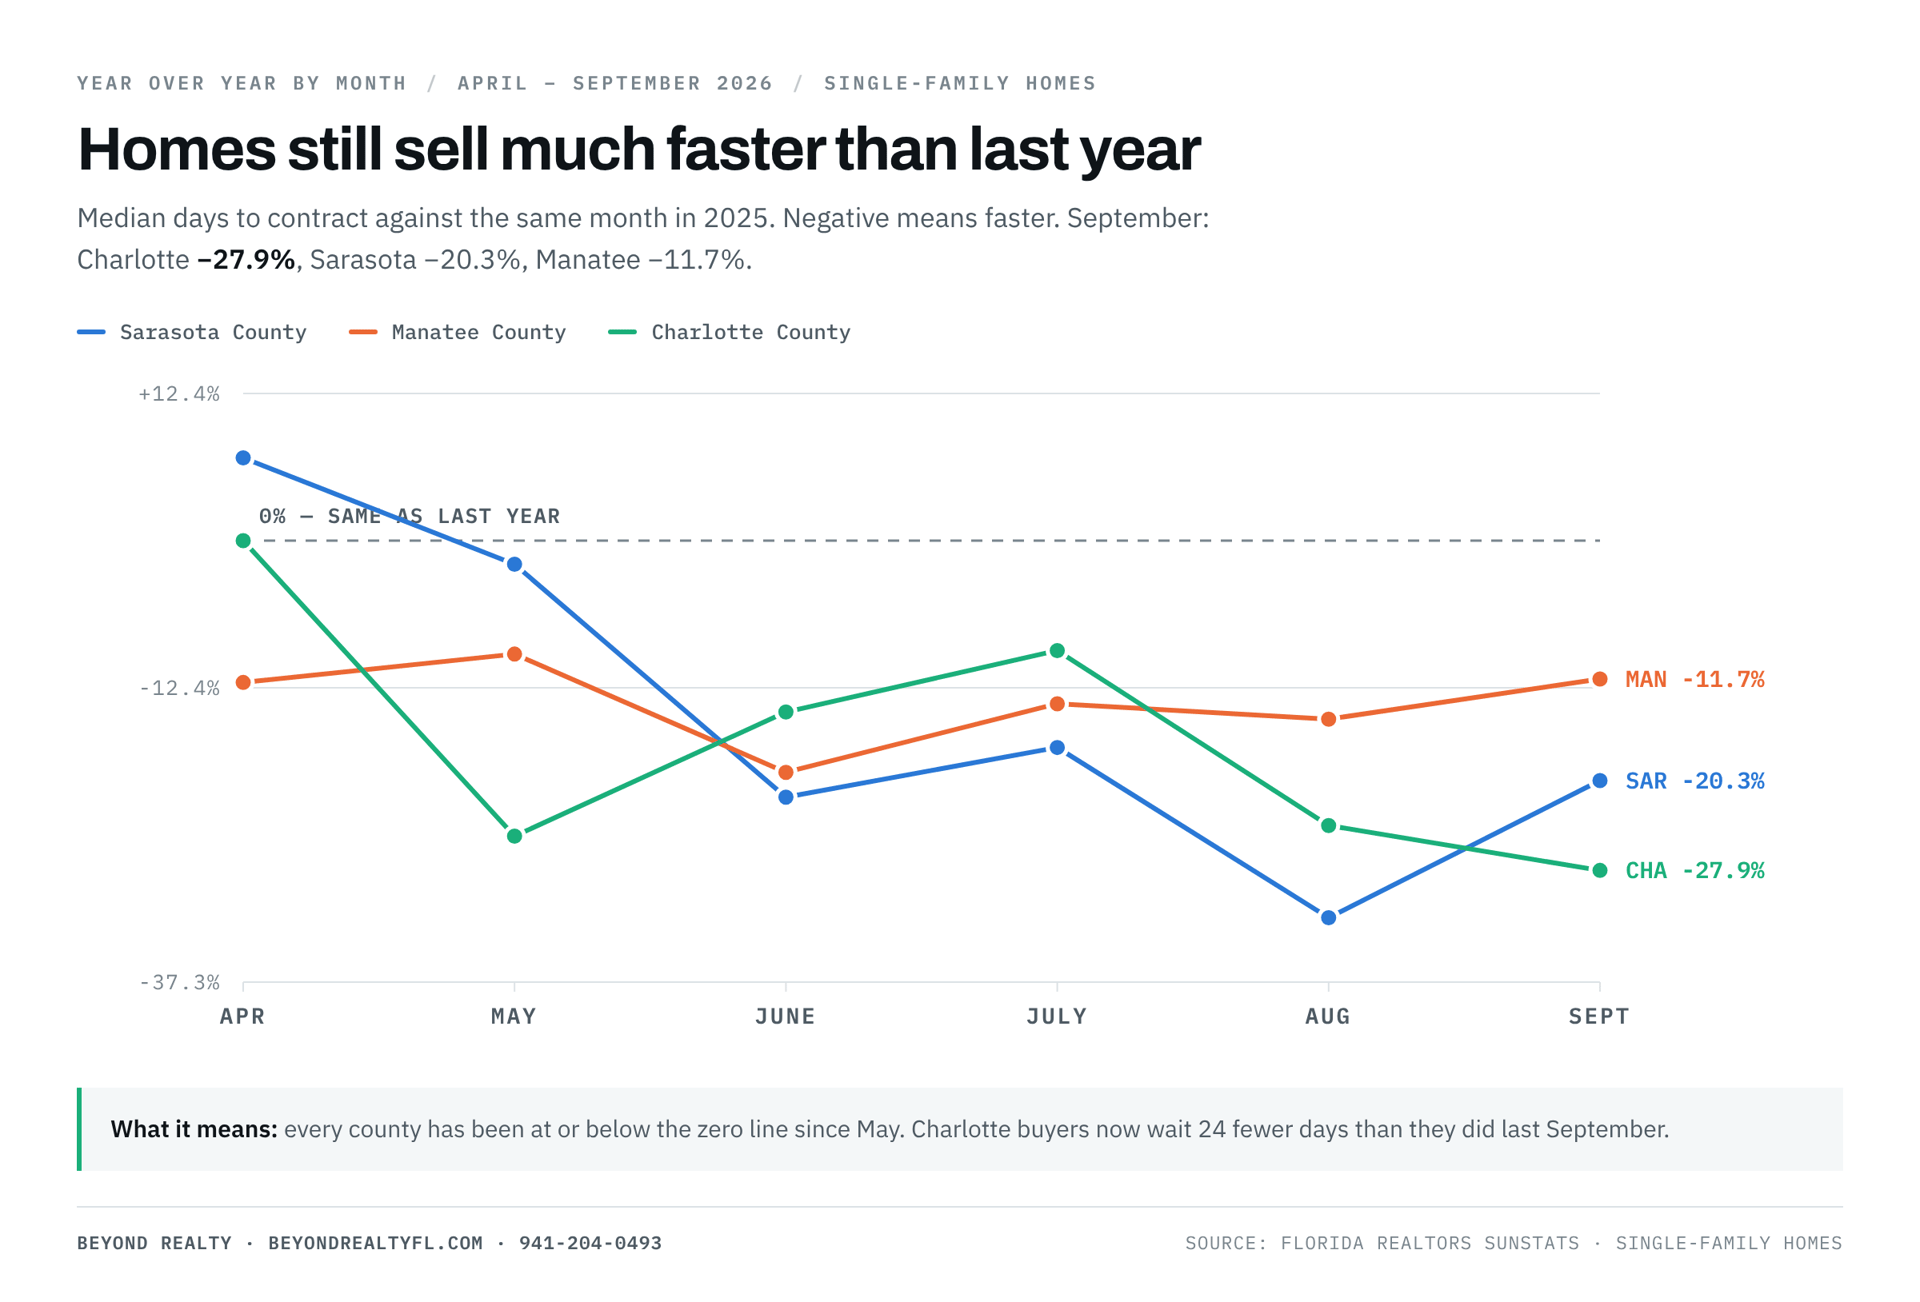
Sarasota County is a seller's market as of September 2026. Months supply was 3.7, the second consecutive month below the four-month threshold and down from 4.8 a year earlier. Homes went under contract in a median of 51 days versus 64 a year ago, and sellers kept 94.3% of their original asking price.
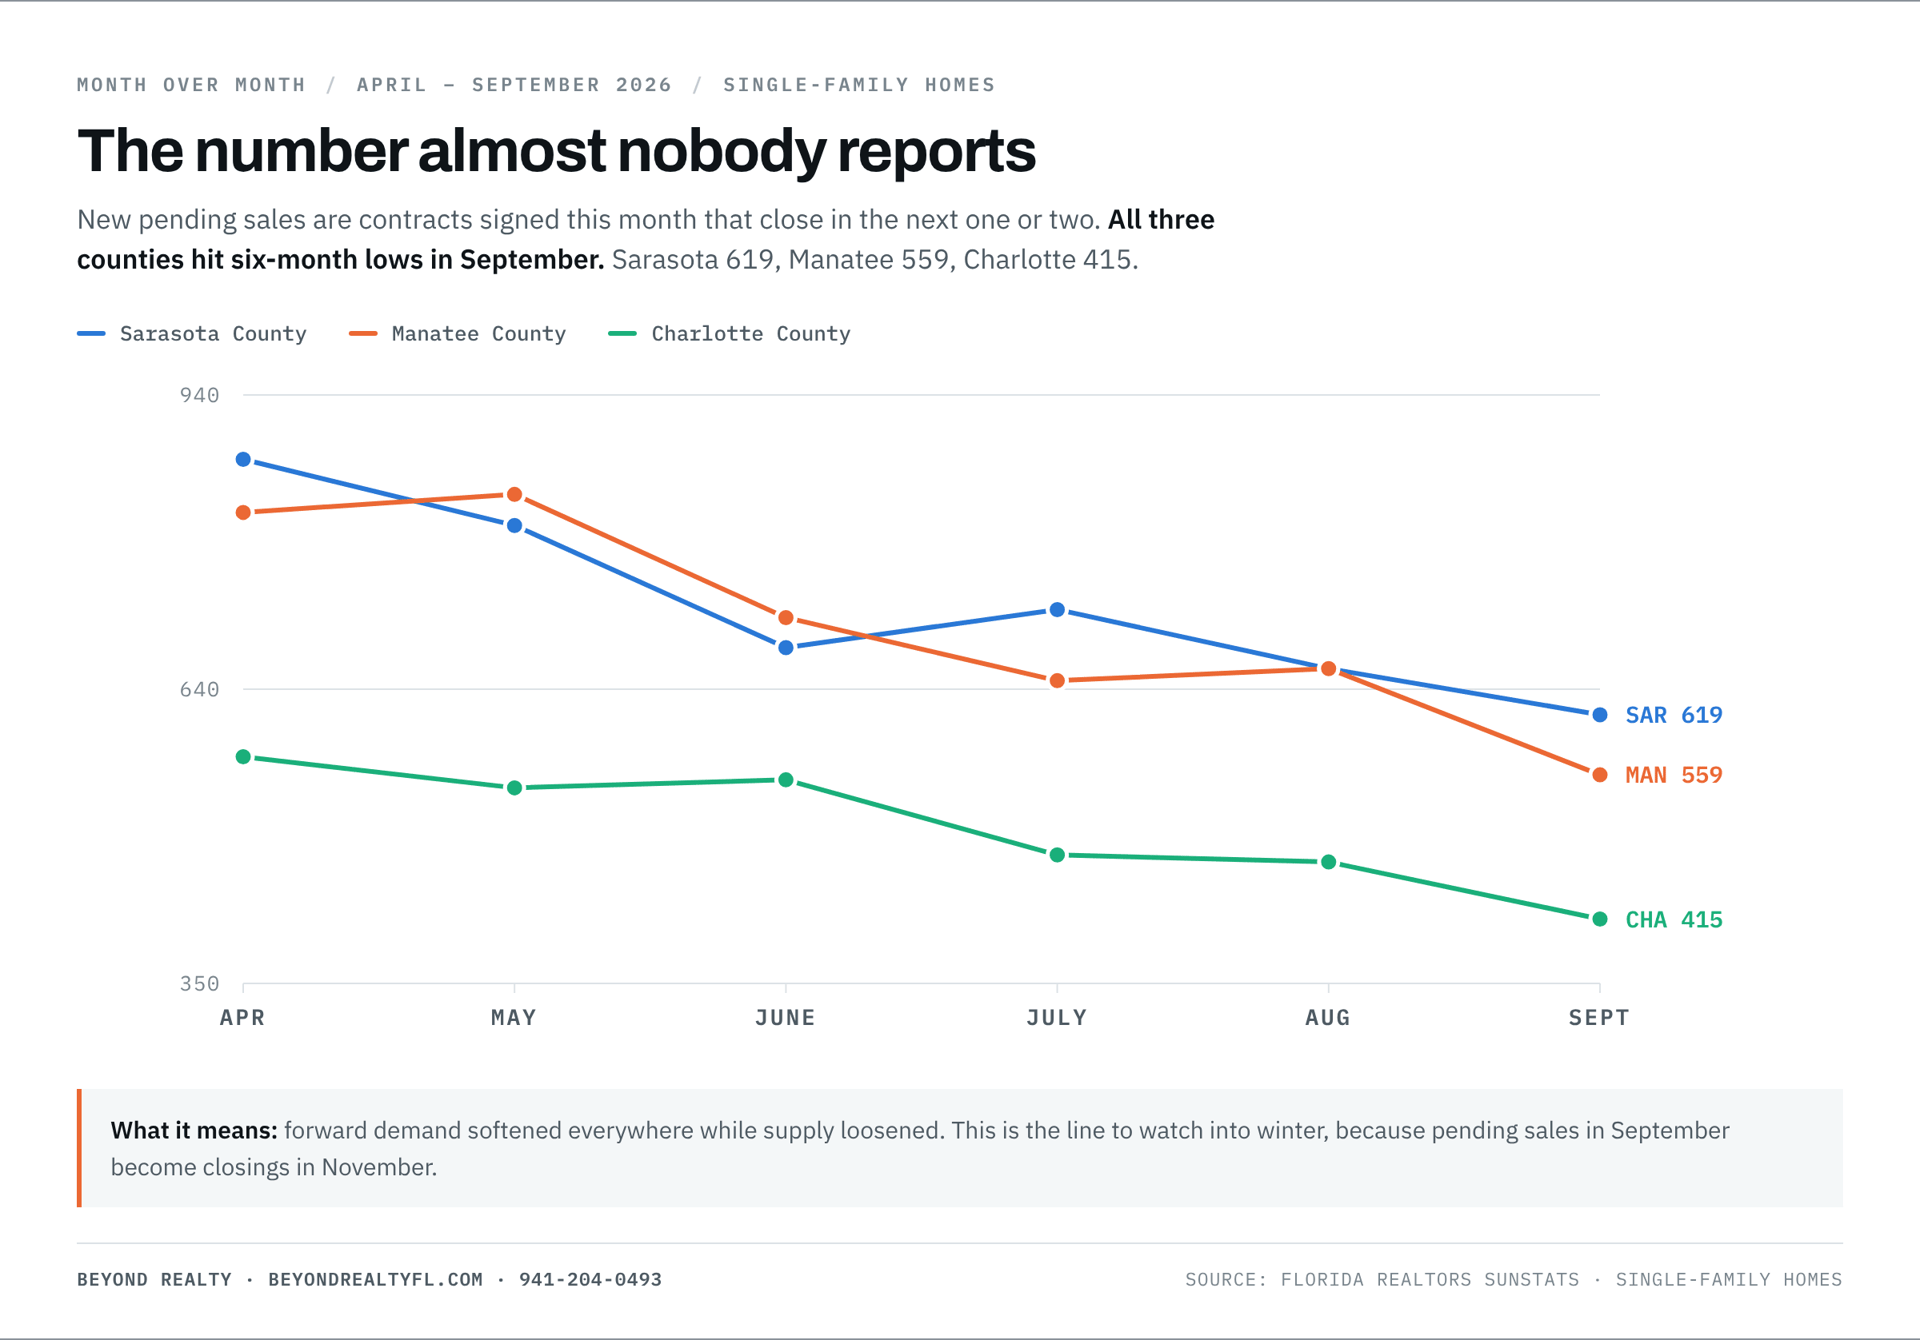
The qualifier is that the conditions creating that leverage stopped intensifying in September. Active inventory ticked up, new listings rose 6.5%, and new pending sales fell 2.8% year over year to 619. Seller leverage in Sarasota is strong and no longer growing.
Sarasota County (Single-Family) | Apr | May | Jun | Jul | Aug | Sep 2026 | Sep 2025 | Y/Y |
|---|---|---|---|---|---|---|---|---|
Closed Sales | 824 | 845 | 805 | 744 | 646 | 681 | 646 | +5.4% |
Median Sale Price | $490,000 | $475,000 | $492,450 | $493,500 | $470,000 | $485,000 | $450,000 | +7.8% |
Average Sale Price | $814,685 | $673,741 | $732,527 | $764,307 | $670,413 | $985,116 | $645,845 | +52.5% |
Dollar Volume | $671.3M | $569.3M | $589.7M | $568.6M | $433.1M | $670.9M | $417.2M | +60.8% |
Median % of Original List | 94.3% | 94.2% | 94.4% | 94.2% | 94.7% | 94.3% | 92.2% | +2.3% |
Median Time to Contract | 46 days | 50 days | 47 days | 52 days | 47 days | 51 days | 64 days | −20.3% |
New Listings | 989 | 924 | 753 | 789 | 762 | 803 | 754 | +6.5% |
New Pending Sales | 874 | 808 | 686 | 724 | 665 | 619 | 637 | −2.8% |
Active Inventory | 3,258 | 3,099 | 2,870 | 2,736 | 2,619 | 2,629 | 3,137 | −16.2% |
Months Supply | 4.7 | 4.4 | 4.1 | 3.9 | 3.7 | 3.7 | 4.8 | −22.9% |
Cash Sales (% of closed) | 43.9% | 42.0% | 39.0% | 33.6% | 37.3% | 42.1% | 40.4% | n/a |
What stands out: cash buyers returned to 42.1% of closings, up from a low of 33.6% in July. That reverses the trend we flagged over the summer and makes Sarasota meaningfully less sensitive to mortgage rates than it was three months ago. You can browse current availability on our active Sarasota-area listings page.
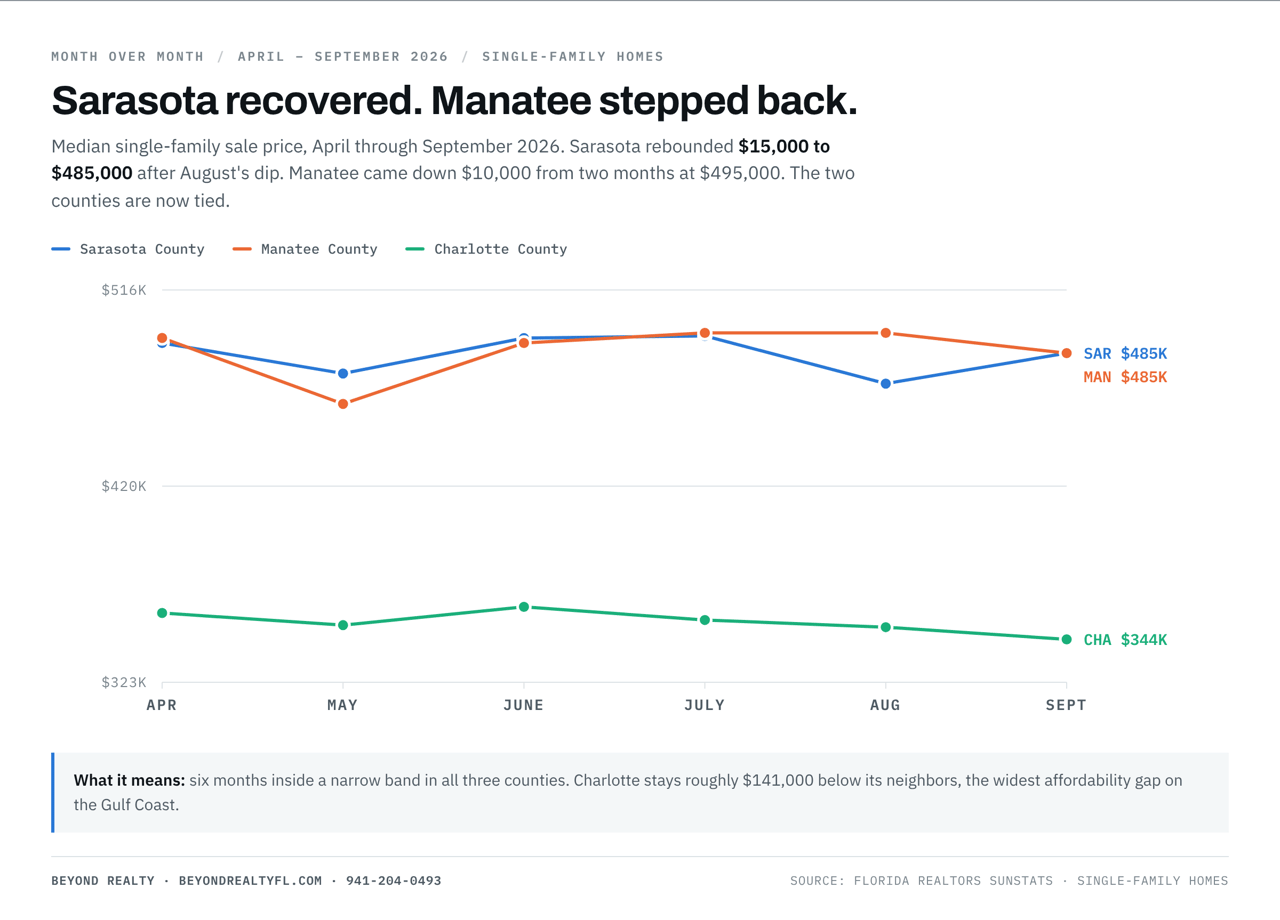
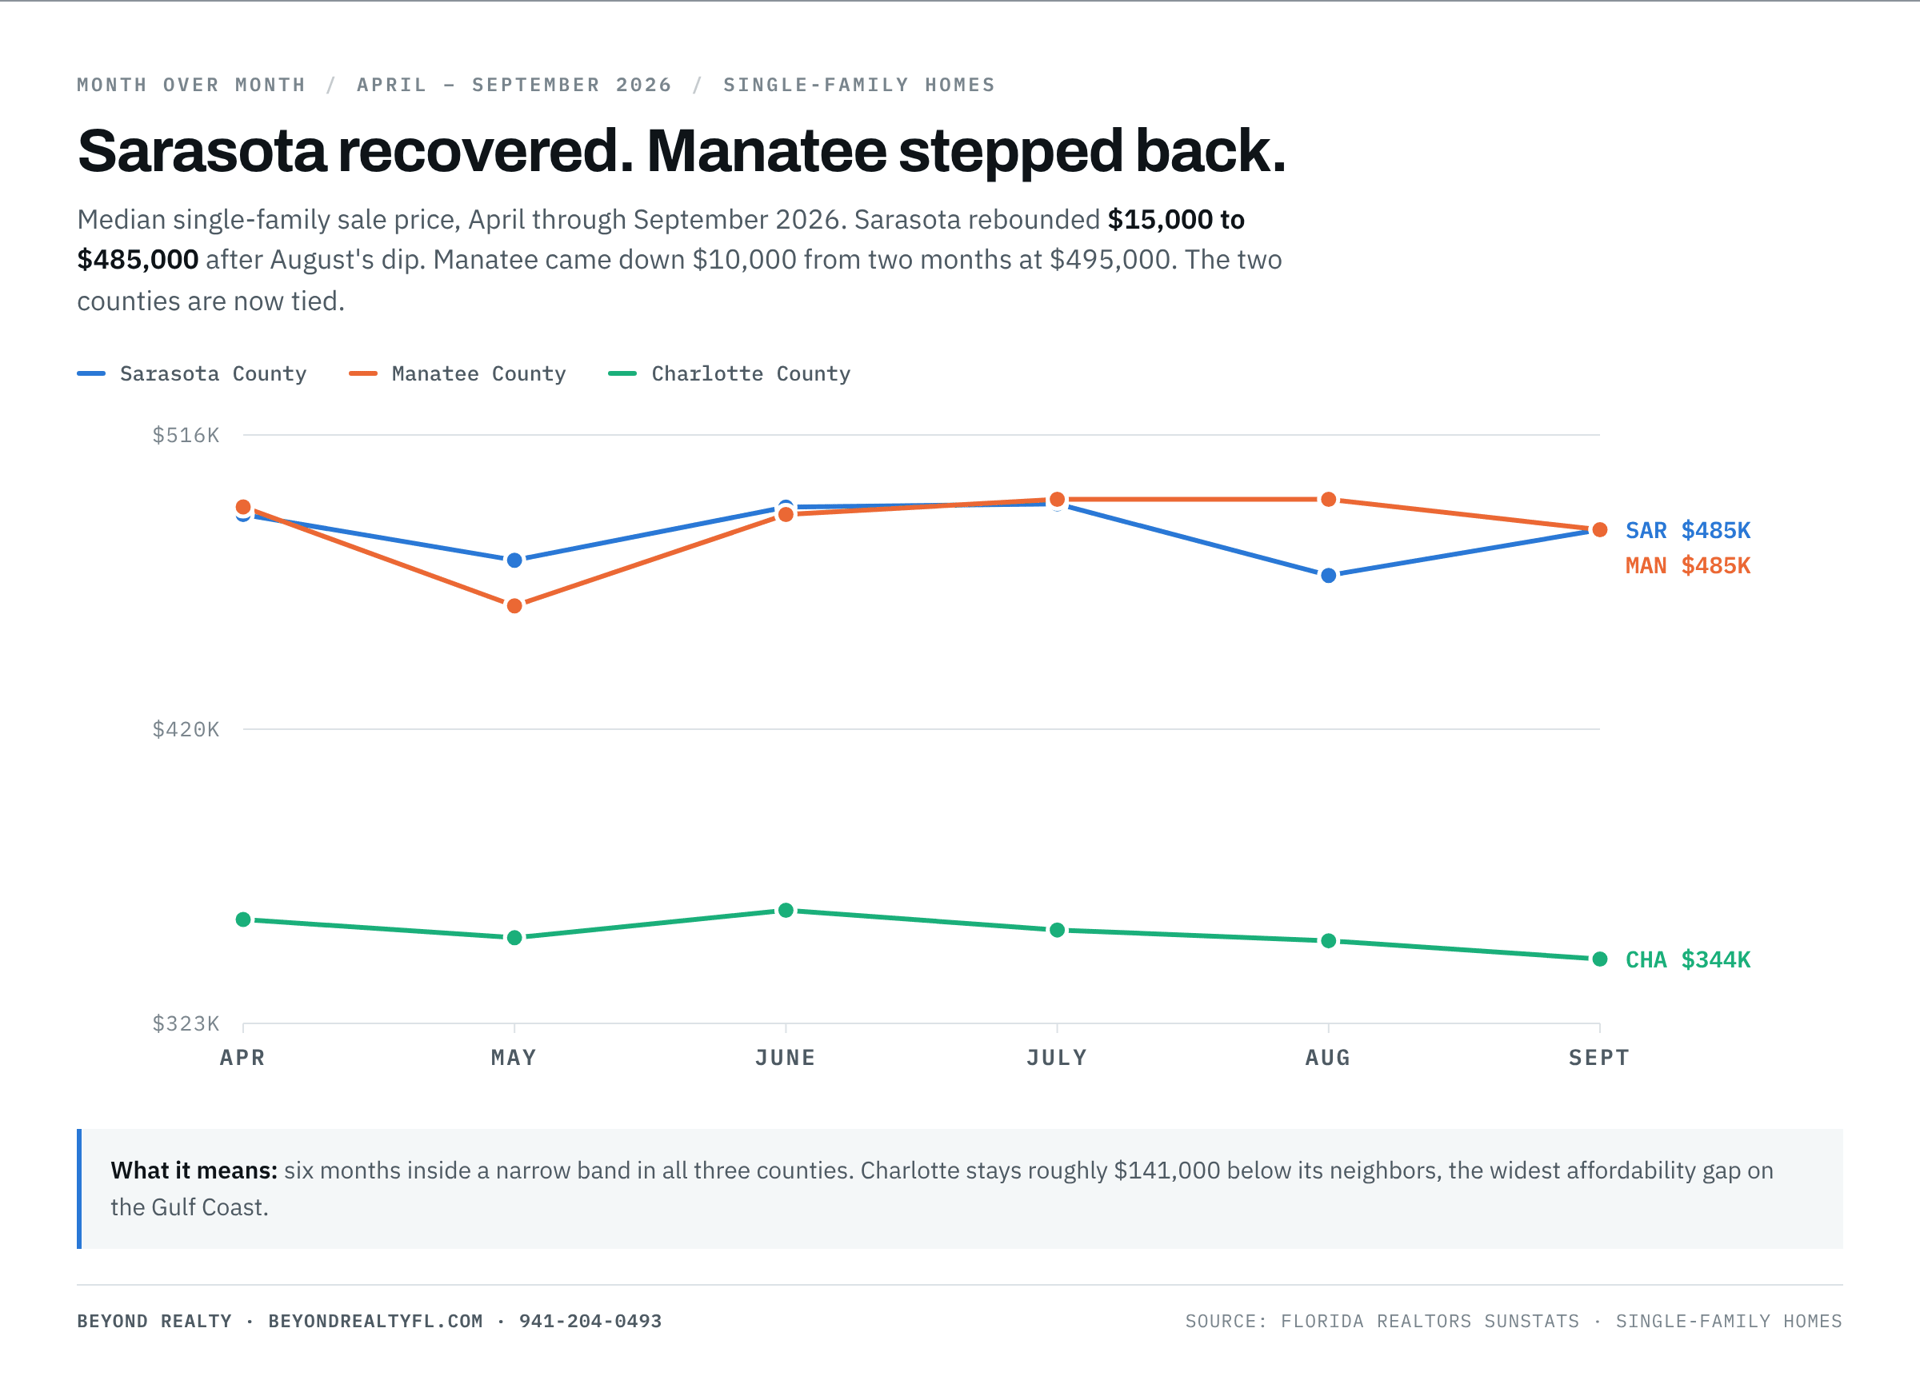
Manatee County's median sale price rose 3.2% year over year to $485,000 in September 2026, but fell $10,000 from August. That ends a two-month stretch where the county median printed exactly $495,000, and it brings Manatee back into a tie with Sarasota after briefly leading the region.
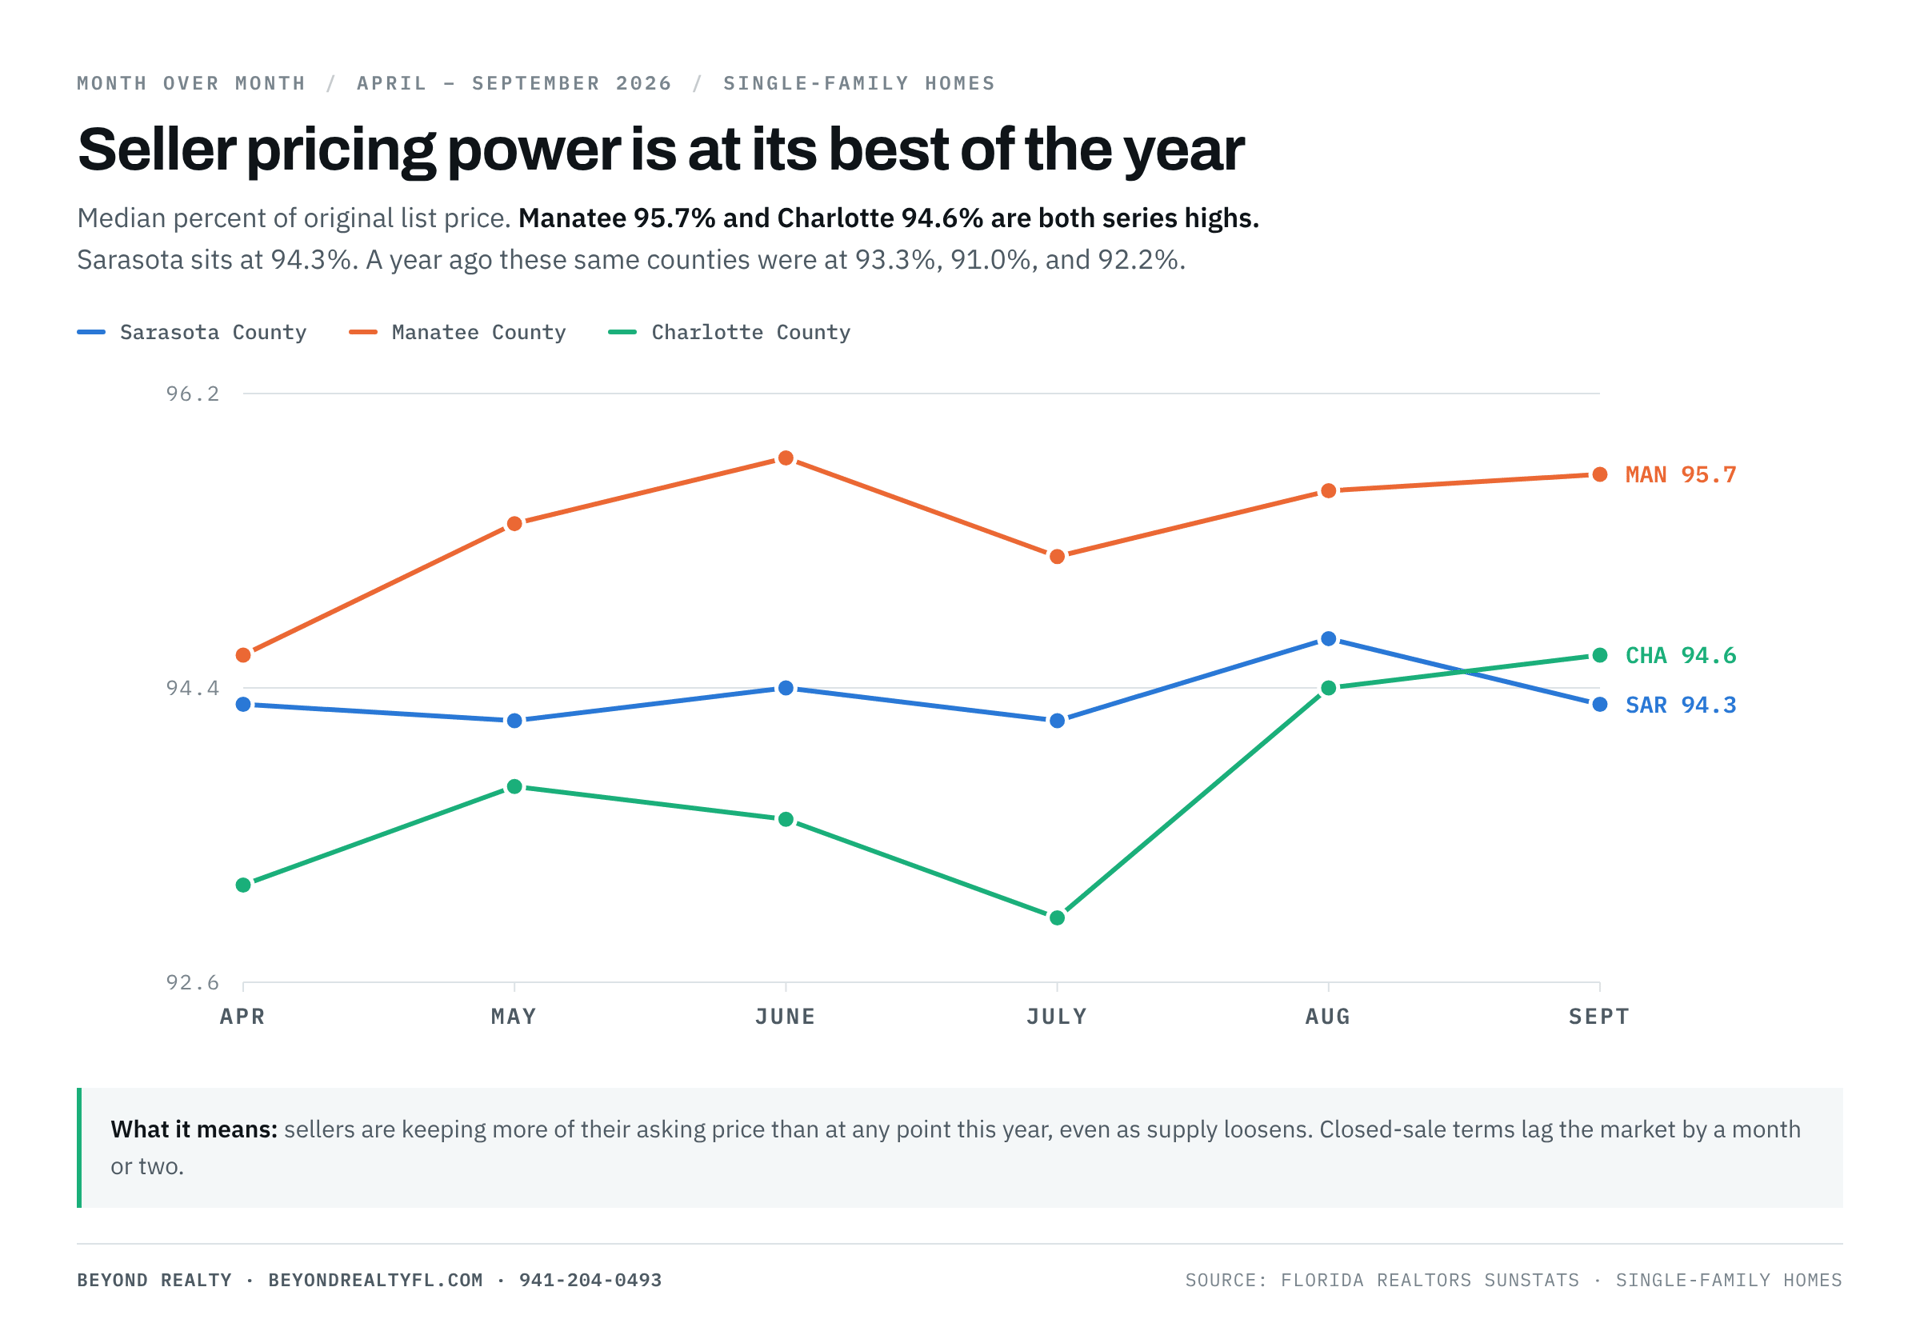
Manatee was the only county of the three to post a clearly negative closed sales figure, down 3.9% to 636. New pending sales also fell, down 3.6% to 559. At the same time, the county holds the region's strongest seller pricing power at 95.7% of original list price, the highest reading in this six-month series.
Manatee County (Single-Family) | Apr | May | Jun | Jul | Aug | Sep 2026 | Sep 2025 | Y/Y |
|---|---|---|---|---|---|---|---|---|
Closed Sales | 704 | 782 | 890 | 694 | 687 | 636 | 662 | −3.9% |
Median Sale Price | $492,500 | $460,000 | $490,000 | $495,000 | $495,000 | $485,000 | $470,000 | +3.2% |
Average Sale Price | $760,094 | $667,503 | $648,560 | $675,943 | $663,878 | $629,444 | $593,139 | +6.1% |
Dollar Volume | $535.1M | $522.0M | $577.2M | $469.1M | $456.1M | $400.3M | $392.7M | +2.0% |
Median % of Original List | 94.6% | 95.4% | 95.8% | 95.2% | 95.6% | 95.7% | 93.3% | +2.6% |
Median Time to Contract | 44 days | 47 days | 45 days | 50 days | 45 days | 53 days | 60 days | −11.7% |
New Listings | 957 | 889 | 831 | 821 | 735 | 741 | 681 | +8.8% |
New Pending Sales | 821 | 839 | 716 | 653 | 665 | 559 | 580 | −3.6% |
Active Inventory | 2,929 | 2,832 | 2,706 | 2,724 | 2,616 | 2,610 | 2,656 | −1.7% |
Months Supply | 4.6 | 4.4 | 4.1 | 4.1 | 3.9 | 3.9 | 4.2 | −7.1% |
Cash Sales (% of closed) | 32.8% | 27.0% | 25.2% | 27.7% | 26.6% | 28.3% | 29.9% | n/a |
What stands out: Manatee is the only county where both halves of the equation softened at once. Sellers returned (new listings +8.8%, the largest gain in the region) and buyers stepped back (closed sales −3.9%, new pendings −3.6%). That combination is what actually loosens a market, and it is worth watching here before it is worth watching anywhere else. At 28.3% cash, Manatee also remains the most rate-sensitive county in the region. If you are weighing the master-planned corridor east of I-75, start with our Lakewood Ranch community guide.
Charlotte County sits at 4.9 months of supply as of September 2026, inside the balanced band and up from 4.7 in August, but down sharply from 6.9 a year earlier. It is no longer the deep buyer's market it was in 2025, and September was the first month in this series where its supply picture moved back toward buyers.
Charlotte produced the most interesting split of the three counties. Its supply loosened, with active inventory rising from 2,277 to 2,360 and new listings jumping 94 homes in a single month. Yet its seller leverage numbers reached their best levels of the year: 94.6% of original list price, the highest in this six-month series, and 62 days to contract against 86 a year ago, a 27.9% improvement and the largest speed gain in the region.
Charlotte County (Single-Family) | Apr | May | Jun | Jul | Aug | Sep 2026 | Sep 2025 | Y/Y |
|---|---|---|---|---|---|---|---|---|
Closed Sales | 531 | 562 | 537 | 528 | 448 | 430 | 432 | −0.5% |
Median Sale Price | $357,000 | $351,000 | $360,000 | $353,545 | $350,000 | $344,000 | $330,000 | +4.2% |
Average Sale Price | $420,379 | $439,145 | $431,485 | $443,931 | $419,907 | $419,599 | $394,820 | +6.3% |
Dollar Volume | $223.2M | $246.8M | $231.7M | $234.4M | $188.1M | $180.4M | $170.6M | +5.8% |
Median % of Original List | 93.2% | 93.8% | 93.6% | 93.0% | 94.4% | 94.6% | 91.0% | +4.0% |
Median Time to Contract | 56 days | 54 days | 65 days | 78 days | 60 days | 62 days | 86 days | −27.9% |
New Listings | 648 | 609 | 530 | 588 | 540 | 634 | 623 | +1.8% |
New Pending Sales | 577 | 546 | 554 | 479 | 472 | 415 | 413 | +0.5% |
Active Inventory | 2,891 | 2,789 | 2,449 | 2,422 | 2,277 | 2,360 | 2,984 | −20.9% |
Months Supply | 6.1 | 5.9 | 5.1 | 5.0 | 4.7 | 4.9 | 6.9 | −29.0% |
Cash Sales (% of closed) | 40.9% | 44.7% | 37.1% | 38.3% | 34.2% | 37.0% | 38.4% | n/a |
What stands out: Charlotte remains the affordability play on the Gulf Coast at a $344,000 median, roughly $141,000 below both Sarasota and Manatee. It also still offers the longest negotiating window in the region at 62 days to contract. The supply reversal in September is real and buyers should note it, but a 4.0-point improvement in seller pricing power year over year is the larger structural story.
A single year-over-year percentage is a comparison between two months, not a direction. The comparison base changes every month, which is why the same metric can swing wildly without the underlying market changing character. Tracking the year-over-year figure across months is what separates signal from noise.
Median sale price, year-over-year change by month
County | Apr | May | Jun | Jul | Aug | Sep |
|---|---|---|---|---|---|---|
Sarasota | +4.3% | +2.2% | +8.2% | +5.0% | −1.1% | +7.8% |
Manatee | +6.1% | −3.8% | +11.4% | +1.0% | +5.9% | +3.2% |
Charlotte | +2.0% | +8.0% | +7.5% | +2.5% | +1.4% | +4.2% |
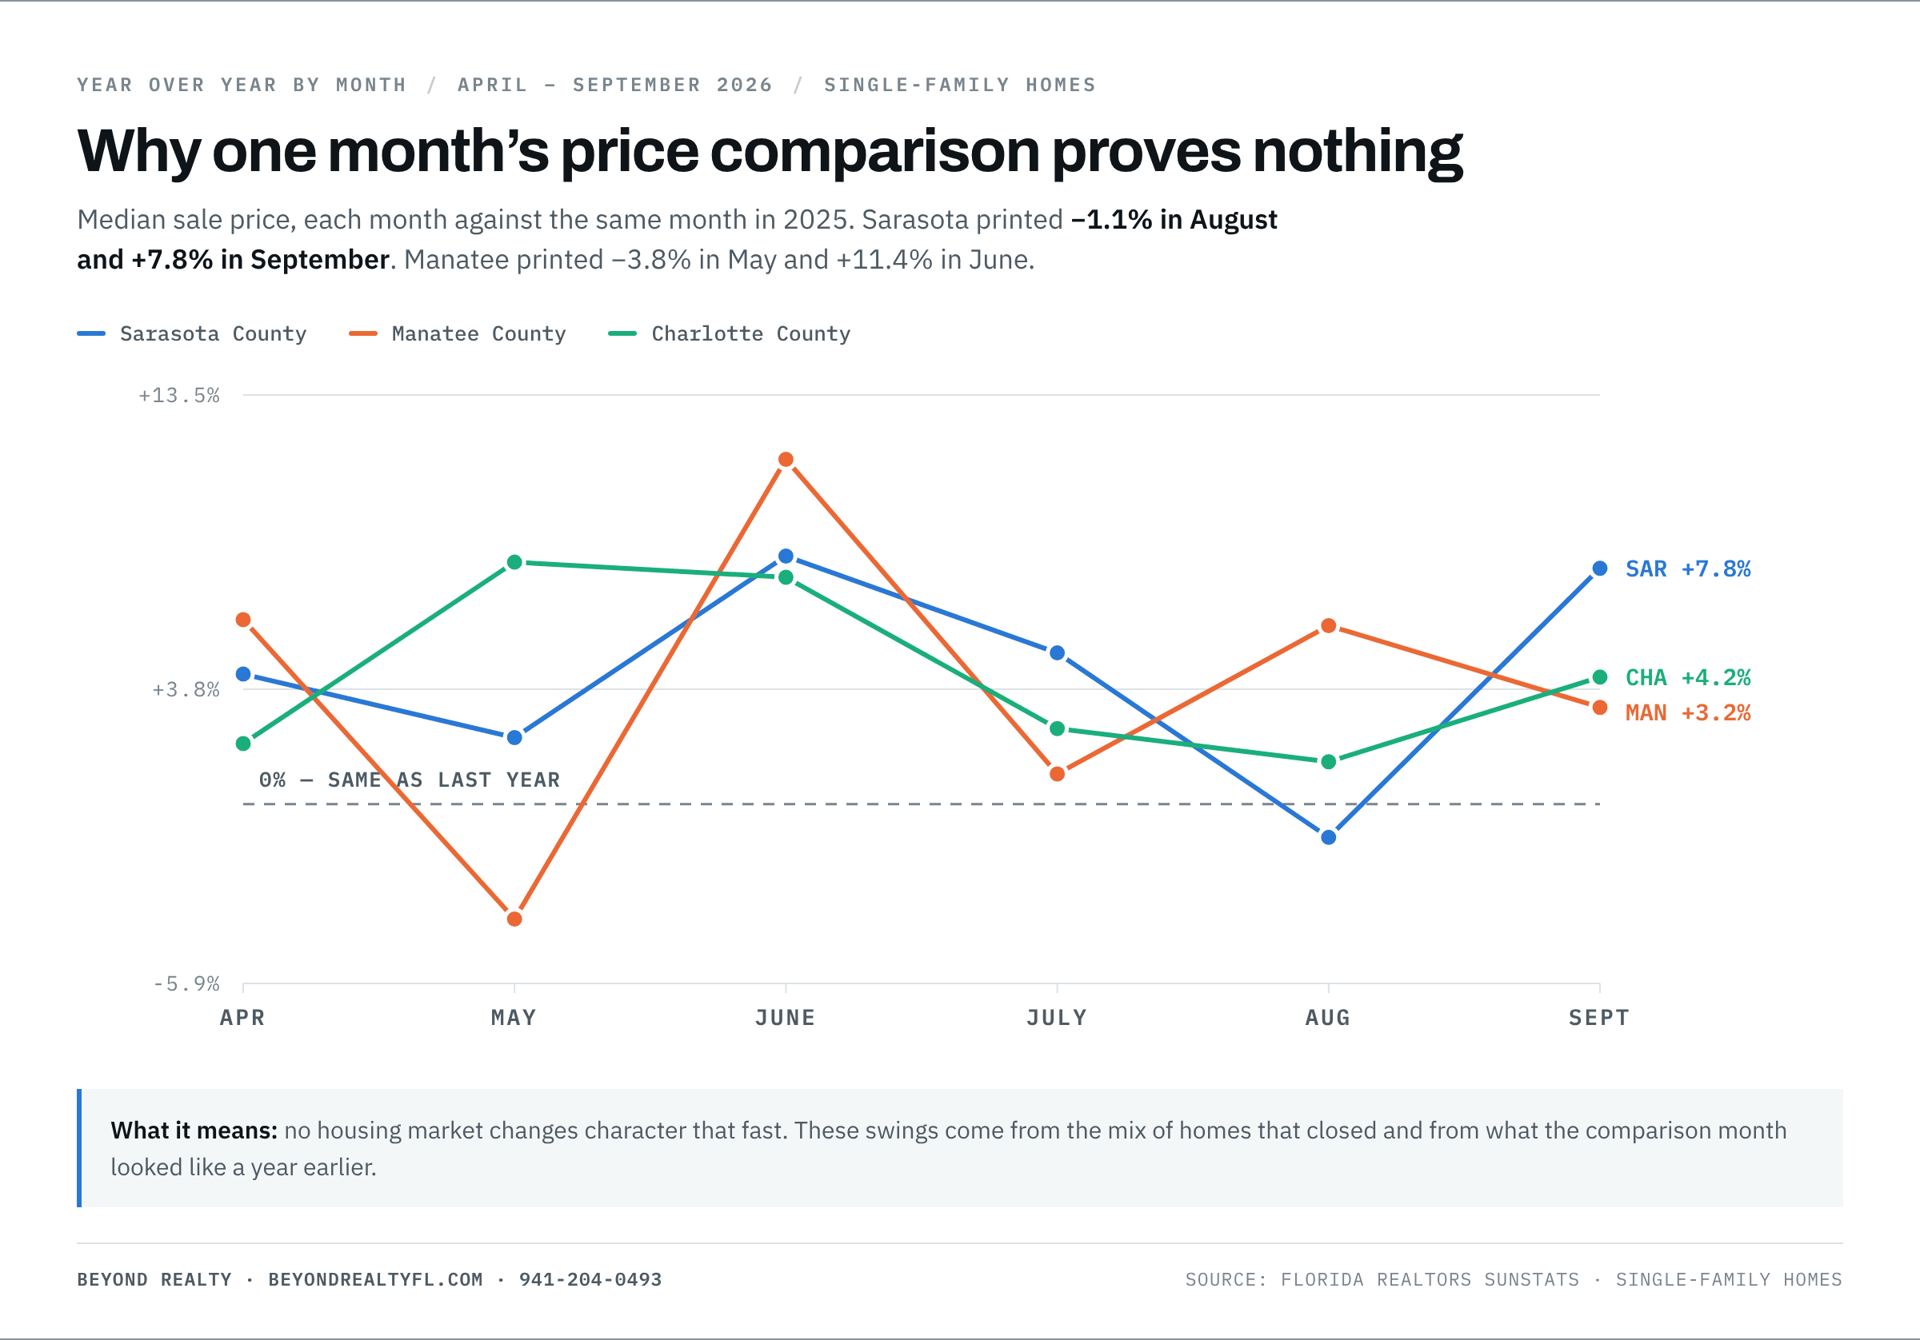
Sarasota printed −1.1% in August and +7.8% in September. Manatee printed −3.8% in May and +11.4% in June. No housing market changes character that quickly. These swings come from the mix of homes that closed and from what the comparison month happened to look like a year earlier.
Active inventory, year-over-year change by month
County | Apr | May | Jun | Jul | Aug | Sep |
|---|---|---|---|---|---|---|
Sarasota | −26.8% | −25.2% | −27.4% | −23.4% | −20.8% | −16.2% |
Manatee | −9.9% | −11.8% | −15.3% | −7.9% | −7.0% | −1.7% |
Charlotte | −28.5% | −26.5% | −31.2% | −25.0% | −24.4% | −20.9% |
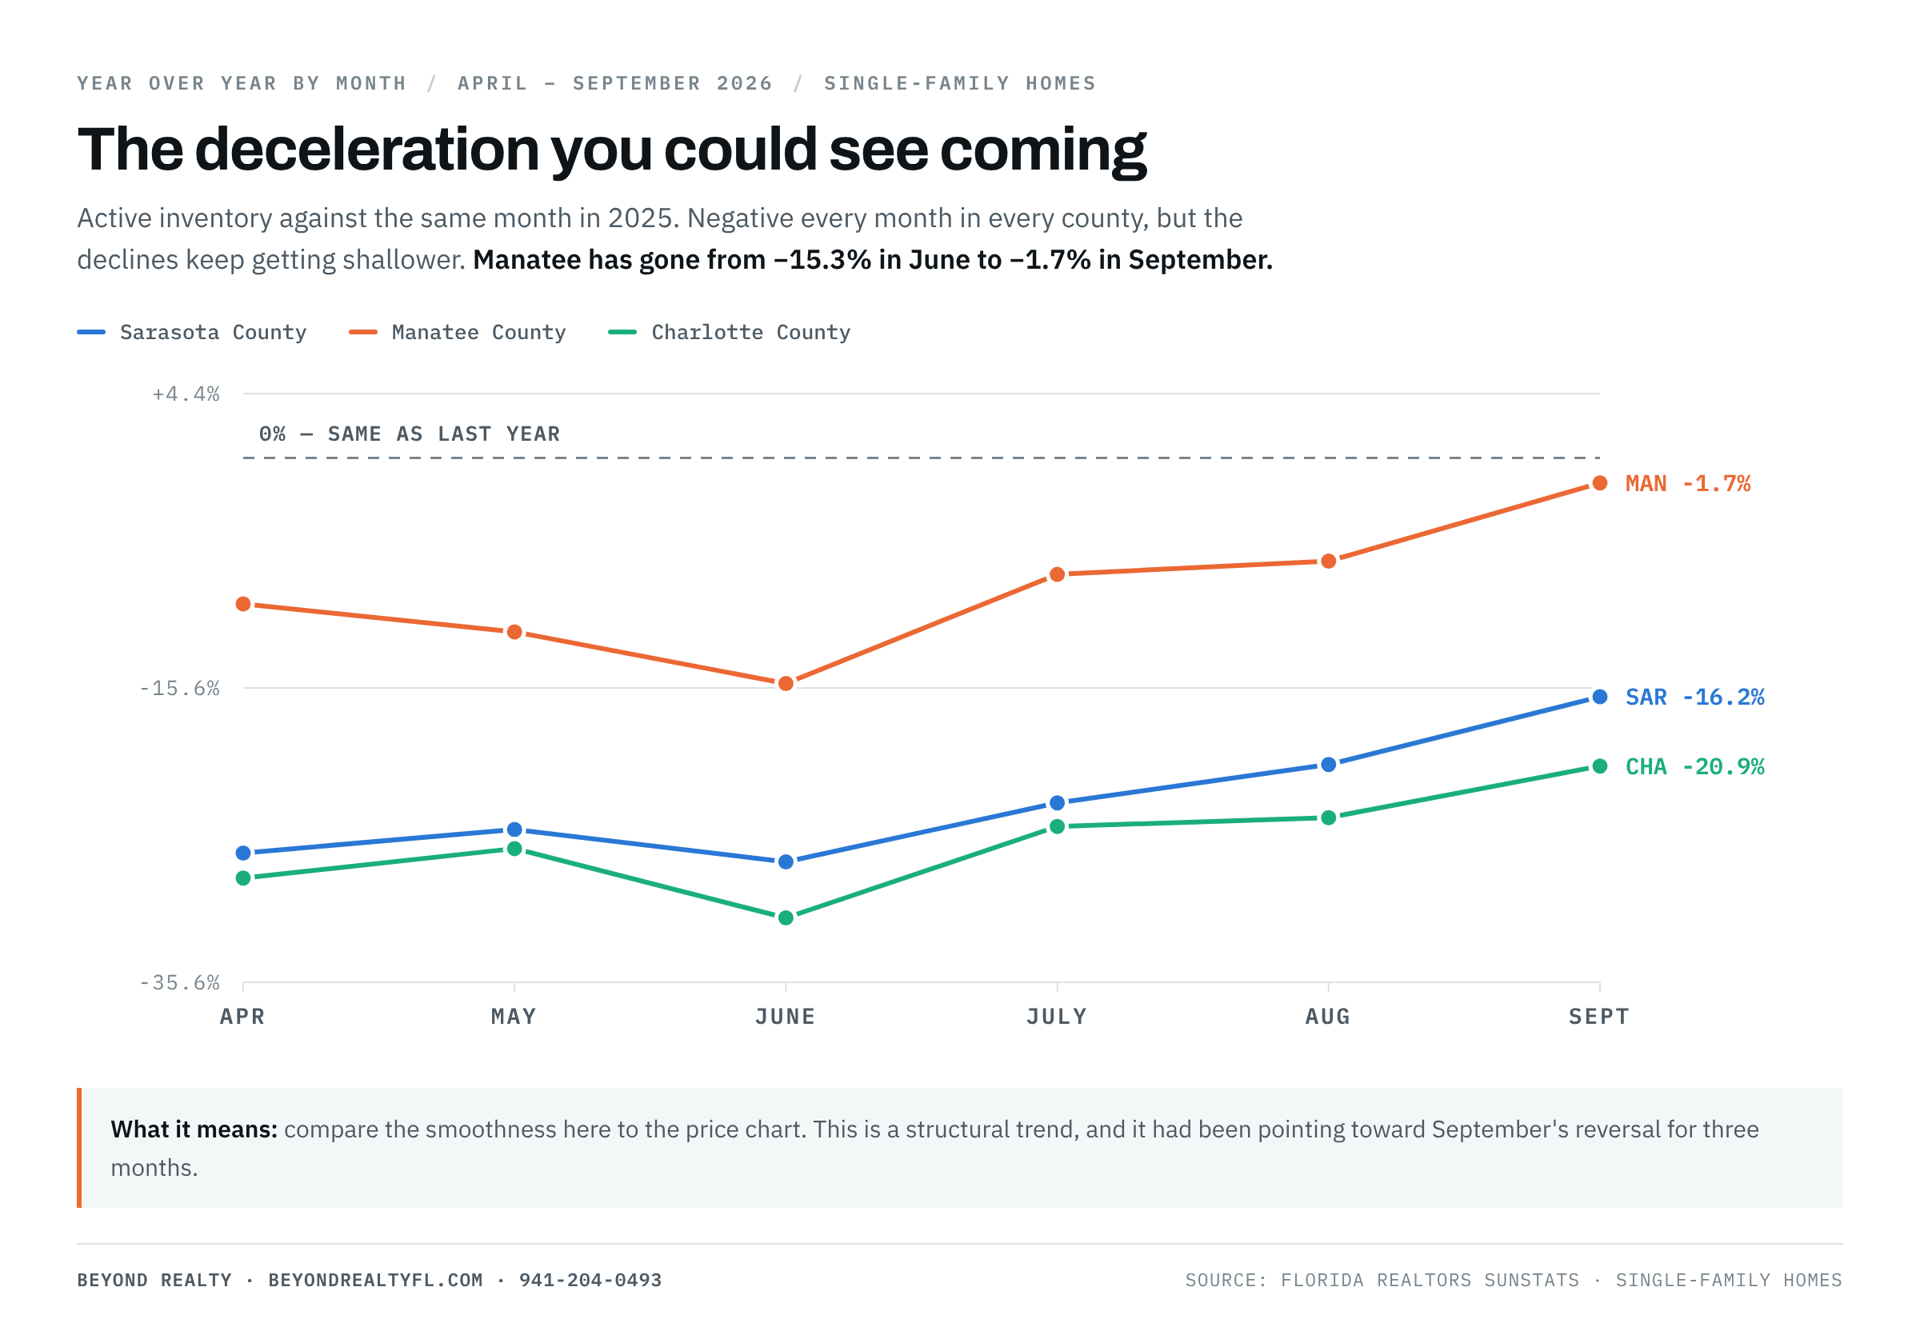
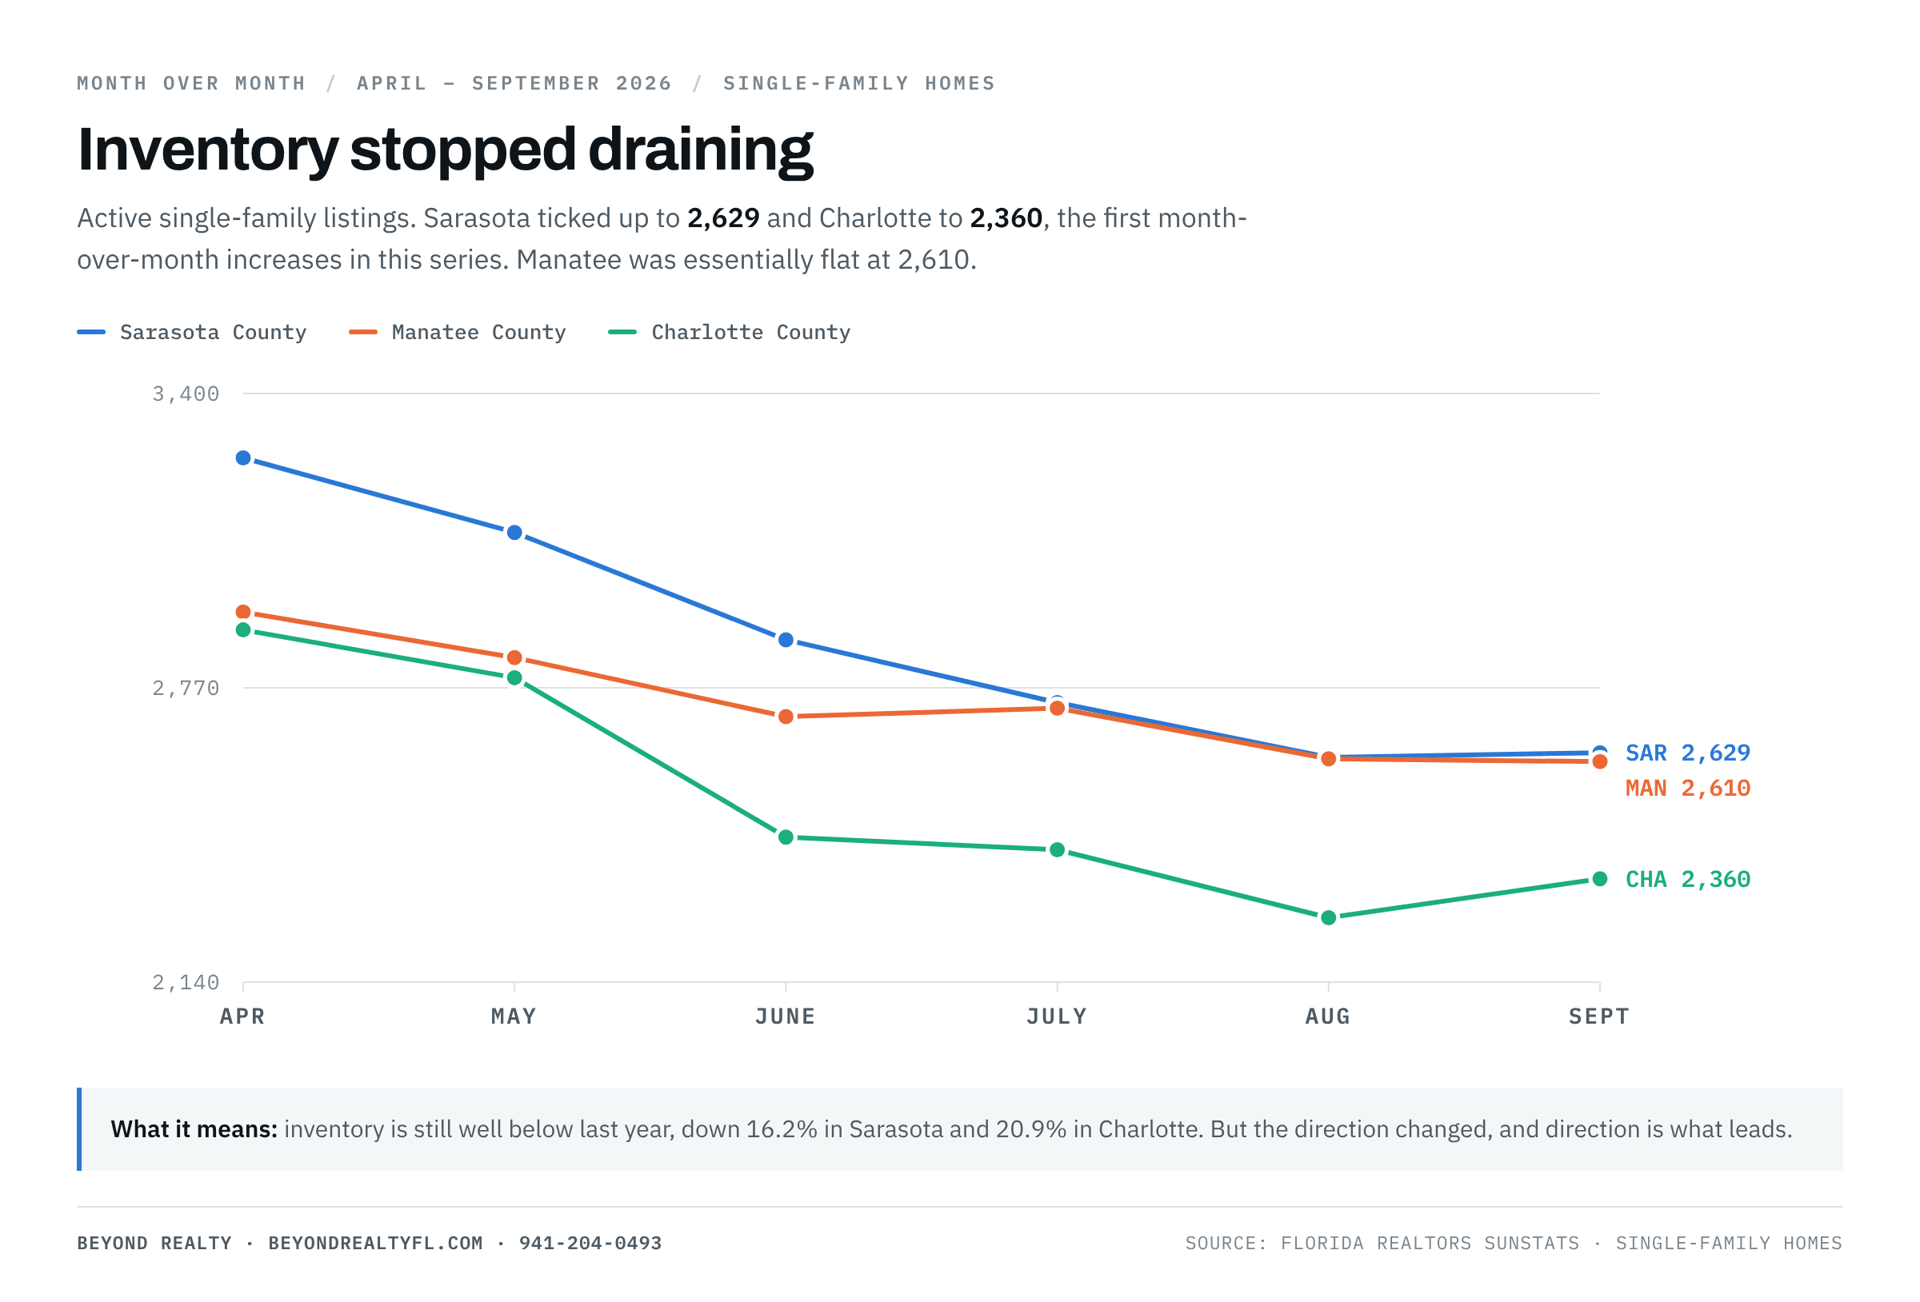
Compare the smoothness of this table to the one above it. Inventory has been negative every month in every county, with no sign changes, which is what a structural trend looks like. But notice the direction of travel: the declines are getting shallower every month in all three counties. Manatee has moved from −15.3% in June to −1.7% in September and is within a rounding error of having as many homes for sale as it did a year ago.
That deceleration, visible for several months, is what arrived fully in September. It is the clearest illustration available of why multi-month tracking beats a single monthly headline.
Buyers gained ground in September 2026 for the first time since the spring, but the gain is in choice rather than price. New listings rose in all three counties, active inventory rose in two of three, and Charlotte's months supply increased outright.
Seller leverage reached or matched its best level of the year in September, but the supply advantage that produced it is now eroding. Median percent of original list price hit 95.7% in Manatee and 94.6% in Charlotte, both series highs, and homes sold 11.7% to 27.9% faster than a year ago.
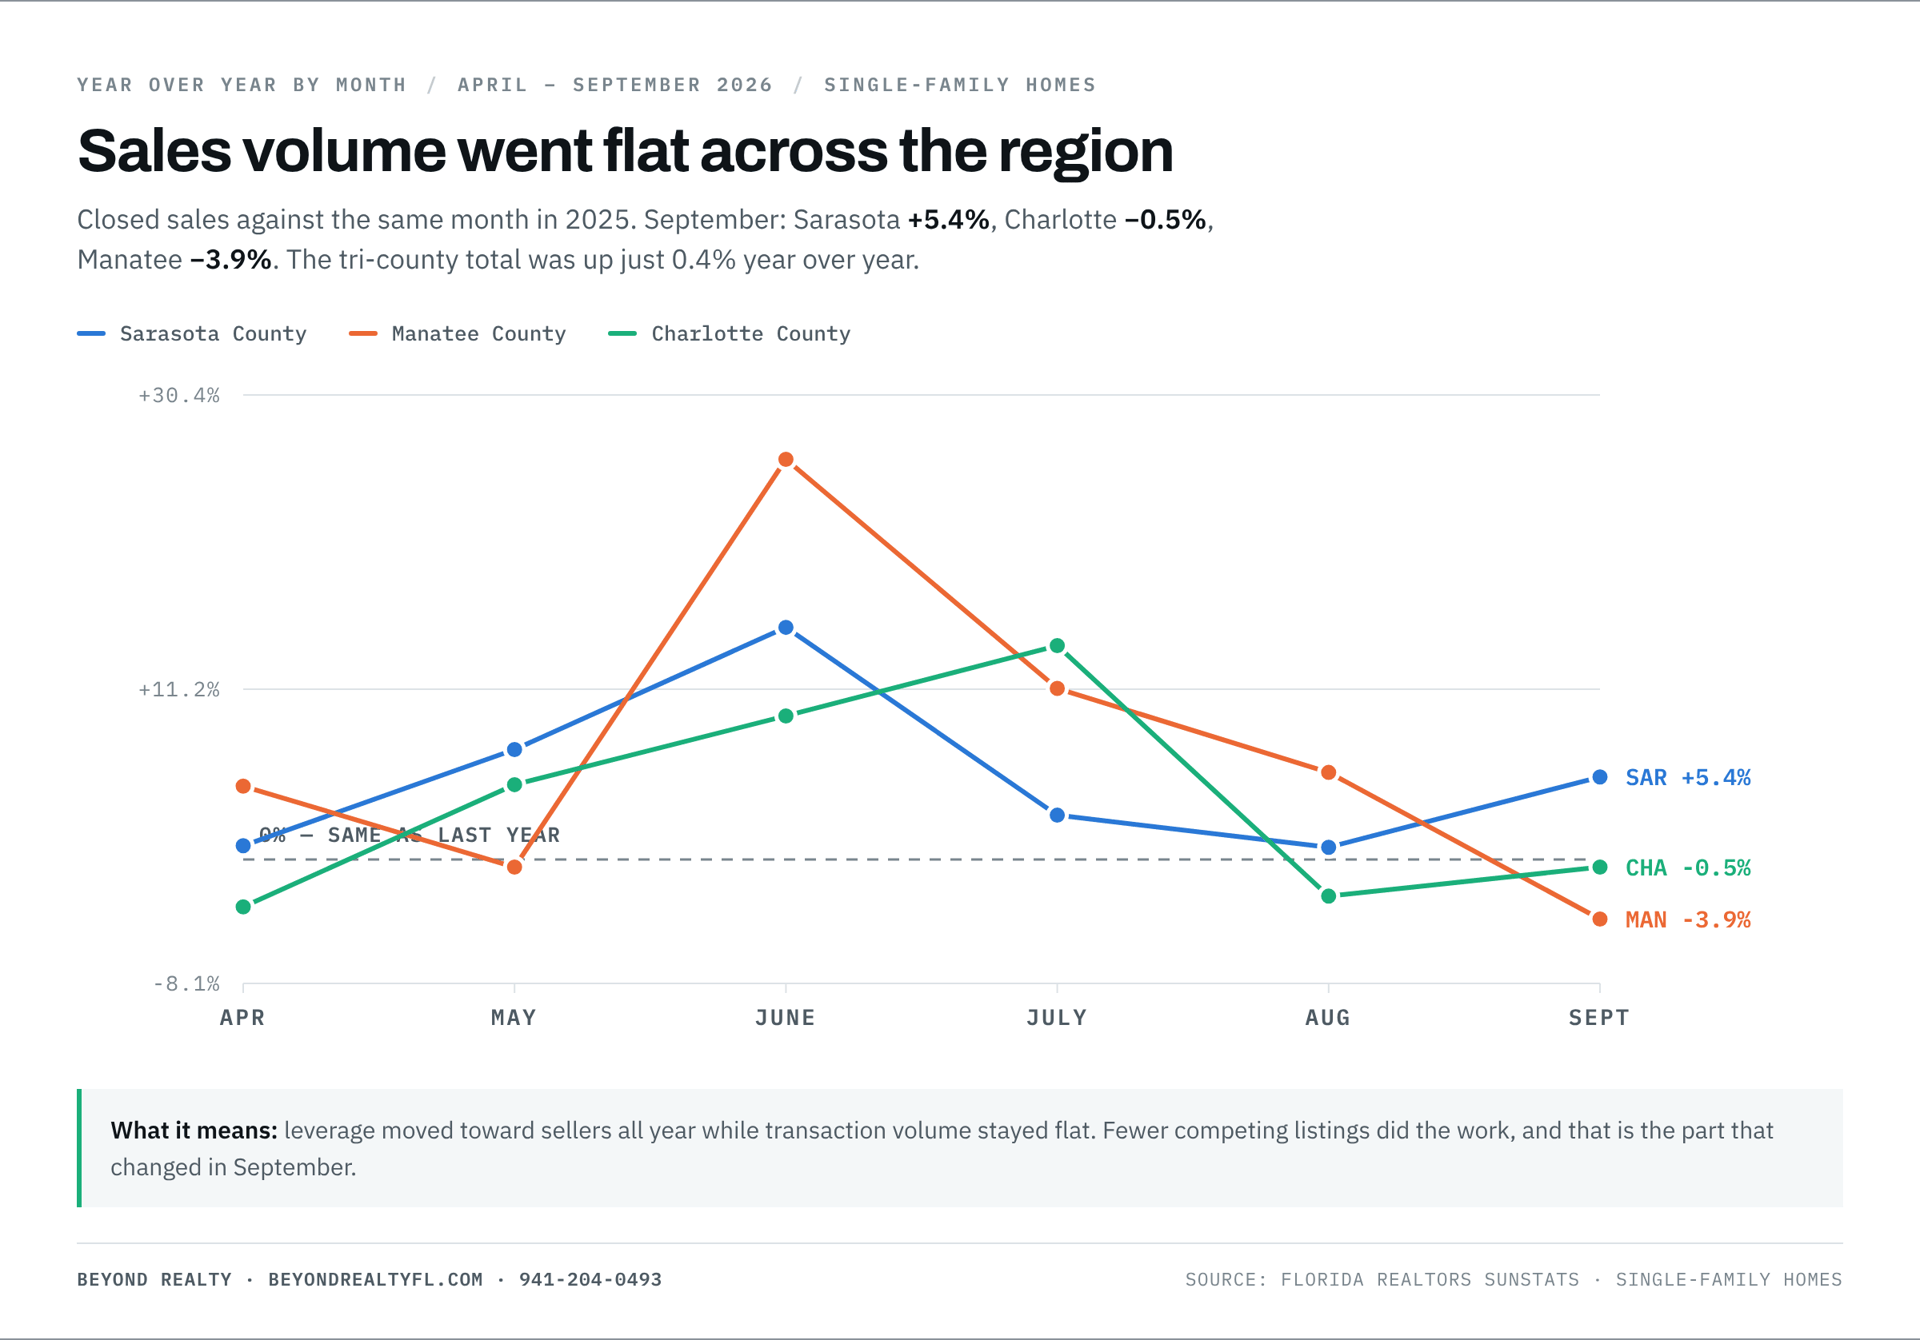 Tri-county closed sales were up just 0.4% year over year in September.
September 2026 was the first month in six where Southwest Florida's inventory squeeze did not intensify. Months supply held flat in Sarasota and Manatee and rose in Charlotte, new listings rose year over year in all three counties, and active inventory ticked up in two of three. Seller leverage remains strong, with pricing power at or near series highs and homes selling substantially faster than a year ago, but it is strong and no longer strengthening.
For anyone making a decision this fall, the practical reading is straightforward. Sellers still hold the advantage and should act while they do. Buyers have more to choose from than at any point since spring, though not at lower prices. And anyone quoting Sarasota's 52.5% average price increase as evidence of a booming market is reading the wrong line of the report.
Data source: Florida Realtors® SunStats (April through September 2026 monthly indicators, single-family homes, Sarasota, Manatee, and Charlotte counties). For statewide context and methodology, see the Florida Realtors® research portal. Statistics reflect MLS-reported closed transactions and are subject to revision.
Is the Southwest Florida housing market cooling in 2026? The inventory squeeze cooled in September 2026, but prices did not. Months supply stopped falling in all three counties and new listings rose year over year in Sarasota (+6.5%), Manatee (+8.8%), and Charlotte (+1.8%). Median sale prices still rose year over year in all three: 7.8% in Sarasota, 3.2% in Manatee, and 4.2% in Charlotte.
What is the median home price in Sarasota County right now? The median single-family sale price in Sarasota County was $485,000 in September 2026, up 7.8% from $450,000 a year earlier. The average sale price was $985,116, but that figure is inflated by a small number of high-end closings and does not describe a typical home.
Why is the average home price so much higher than the median in Sarasota? Because the average is total sales dollars divided by the number of sales, so a few multi-million-dollar closings pull it sharply upward. The median is the middle sale and is unaffected by extremes. In September 2026 Sarasota's average was 2.03 times its median, compared with 1.44 times a year earlier, which indicates unusual luxury activity rather than broad price appreciation.
Is Sarasota a buyer's market or a seller's market? A seller's market. Sarasota County had 3.7 months of inventory supply in September 2026, the second consecutive month below the four-month threshold and down from 4.8 a year earlier. Under four months conventionally favors sellers.
Is Manatee County a seller's market? Yes. Manatee County had 3.9 months of supply in September 2026, below the four-month seller's-market line and down from 4.2 a year earlier. However, closed sales fell 3.9% and new pending sales fell 3.6% year over year, so demand softened in the same month.
Is Punta Gorda still a buyer's market? Not in the way it was. Charlotte County months supply was 4.9 in September 2026, inside the balanced band, down from 6.9 a year earlier. Sellers there now keep 94.6% of original list price versus 91.0% a year ago, and homes go under contract in 62 days versus 86.
Where is the most affordable place to buy a home on Florida's Gulf Coast? Charlotte County, including Punta Gorda, Port Charlotte, and Rotonda, at a $344,000 median single-family price in September 2026. That is roughly $141,000 below both Sarasota and Manatee counties, which both sat at a $485,000 median.
How long does it take to sell a house in Southwest Florida? In September 2026 the median time to contract was 51 days in Sarasota County, 53 days in Manatee County, and 62 days in Charlotte County. Add roughly six to seven weeks from contract to closing, so a typical start-to-finish sale runs three to three and a half months.
Are more homes coming on the market in Southwest Florida? Yes. September 2026 was the second consecutive month in which new listings rose year over year in all three counties, and the first month since April in which months supply did not fall in any county. Active inventory rose month over month in Sarasota and Charlotte.
Are home prices going to drop in Southwest Florida? The September 2026 data does not indicate a decline. Median prices rose year over year in all three counties and seller pricing power reached series highs. What changed is that supply stopped tightening, which historically slows price growth before it reverses it. The figures to watch are months supply, new listings, and new pending sales.
Why are so many Southwest Florida homes bought with cash? Cash accounted for 42.1% of September 2026 closings in Sarasota County, 37.0% in Charlotte, and 28.3% in Manatee, well above the national norm near 20%. Retirees purchasing with equity from northern home sales, second-home buyers, and boaters drive the pattern. A high cash share makes a market less sensitive to mortgage rate changes.
Have questions about what these numbers mean for your street, your neighborhood, or your timeline? That is exactly the conversation we like to have: no pressure, just data and straight answers. Reach out directly, browse our current listings, or request your free home valuation.
Beyond Realty | 2170 Main Street, Suite 103, Sarasota, FL 34237 | 941-204-0493
Darren Dowling is a Sarasota-based real estate broker-owner specializing in Sarasota, Manatee, and Charlotte County residential real estate, new construction, and relocation. He publishes this market breakdown every month using the same source and methodology.

Discover how new construction incentives, price reductions, and quick move-in homes could help buyers find opportunities in Sarasota, Lakewood Ranch, Manatee County, a… Read more
You’ve got questions and we can’t wait to answer them.